

Financing Asia’s Energy Transition: Role of Climate Bonds in Scaling Emerging Technologies in China, India, and the Republic of Korea

Asia's energy transition requires long-term capital at a scale public finance alone cannot supply, and climate bonds have emerged as a principal instrument for mobilising it. This article examines how corporate green and sustainability bond finance is allocated within the energy and utilities (E&U) sectors of China, India, and the Republic of Korea (ROK), and traces the economy-wide consequences of those allocations. Firm-level E&U bond issuances are mapped through creating detailed use-of-proceeds (UoPs) profiles, integrated by sector and region into the EXIOBASE 3, an environmentally extended multi-regional input-output (EE-MRIO) framework. This enabled estimation of direct and indirect domestic and cross-border value added, embedded greenhouse gas (GHG) emissions, and employment effects generated by bond-financed investments across global supply chains. Through comparative case studies of China, India, and ROK, the analysis identifies three distinct economy-wide signatures: China, anchored in a domestic manufacturing base, retains roughly 89 per cent of value added at home and carries the lowest GHG intensity, at 928 tonnes CO₂e per million dollars of issuance; ROK, whose taxonomy admits gas-fired generation as a transitional activity, registers the highest GHG intensity, at 2,005 tonnes; and India, dependent on imported components for panel modules and inverters, retains 73 per cent of value added domestically, with 27 per cent externalised across its trading partners, with associated GHG intensity of 1,257 tonnes CO₂e per million dollars of issuance. The results show that taxonomy design, industrial structure, and trade orientation jointly determine whether a climate bond's developmental promise is realised within the issuing economy or distributed across the supply chains that serve it, with direct implications for how alignment with Nationally Determined Contributions (NDCs) should be assessed across the Asia-Pacific.
- climate bonds
- energy transition
- China
- India
- Republic of Korea
- green finance
1. Introduction
Asia’s energy transition is advancing rapidly; however, despite falling renewable energy costs and accelerating technological progress, investment flows remain insufficient. The International Energy Agency (IEA) estimates that annual clean energy investment in emerging and developing economies, excluding China, must increase from the existing approximately USD 260 billion to nearly USD 1.4–1.9 trillion by the early 2030s to remain aligned with global climate goals (IEA, 2023). Southeast Asia alone will require nearly USD 190 billion annually to support long-term decarbonisation pathways and energy system transformation (IEA, 2022). These financing requirements substantially exceed the capacity of public finance alone. Simultaneously, Asia’s increasing exposure to heat stress, floods, sea-level rise, water scarcity, and extreme weather events has made adaptation finance equally critical alongside mitigation investments (United Nations Environment Programme (UNEP), 2024; Asian Development Bank (ADB), 2024).
Despite the rapid expansion of climate finance markets, several structural characteristics continue to constrain sustainable finance mobilisation across emerging economies of Asia. High capital costs, elevated sovereign risk, and currency volatility significantly increase financing costs for renewable energy and low-carbon infrastructure projects in emerging markets (International Renewable Energy Agency (IRENA), 2023; International Monetary Fund (IMF), 2023). Financial systems across many Asian economies remain institutionally bank-dominated, with relatively shallow corporate bond markets and limited institutional investor participation, restricting the availability of long-term transition finance (ADB, 2024). In addition, fragmented sustainable finance taxonomies, inconsistent Environmental, Social, and Governance (ESG) disclosure standards, and weak climate-risk reporting frameworks continue to generate regulatory uncertainty and concerns regarding greenwashing (Organisation for Economic Co-operation and Development (OECD), 2023). These economies also exhibit strong fossil-fuel dependence and carbon lock-in through coal-intensive industrial structures and energy systems, which increase transition risks and complicate capital reallocation toward cleaner technologies (IEA, 2024). Further, although Asia remains among the world’s most climate-vulnerable regions, adaptation finance flows remain substantially below estimated requirements, particularly for resilient infrastructure, water systems, agriculture, and coastal protection (UNEP, 2024; ADB, 2024).
Within this context, green bonds have emerged as one of the most important innovative instruments for mobilising long-term climate finance. Green bonds are debt instruments whose proceeds are earmarked specifically for green transition and environmentally beneficial projects, including renewable energy systems, clean transportation, energy efficiency upgrades, resilient infrastructure, and climate adaptation initiatives (International Capital Market Association (ICMA), 2021). By linking debt issuance with climate-oriented investment, green bonds expand access to long-term capital while attracting environmentally conscious institutional investors and ESG-oriented portfolios (Flammer, 2021). Importantly, green bonds also improve transparency and accountability through disclosure requirements, certification standards, and use-of-proceeds reporting frameworks, thereby strengthening investor confidence in climate-related investments (OECD, 2020). Studies suggest that green bonds generally perform comparably to conventional bonds in financial markets and may occasionally benefit from a “greenium”, where investors accept slightly lower yields in exchange for environmental credibility and reduced transition risk exposure (Zerbib, 2019; Tang & Zhang, 2020). Beyond financial performance, empirical studies increasingly associate green bond issuance with measurable environmental improvements. Firm-level evidence indicates that green bond financing contributes to reductions in carbon emissions, improvements in environmental governance, and increased investment in clean technologies (Flammer, 2021; Tolliver et al., 2020).
However, the literature also highlights significant heterogeneity in the effectiveness and distribution of green finance across countries and sectors. Environmental outcomes depend heavily on institutional setup, depth and structure of financial markets, policy coherence, and industrial structure (Taghizadeh-Hesary & Yoshino, 2020). Studies emphasise that green bonds are most effective when embedded within broader climate policy frameworks supported by clear taxonomies, disclosure standards, transition strategies, and climate-aligned financial regulation (OECD, 2020; IMF, 2023). Governance mechanisms such as third-party verification, environmental reporting obligations, investor monitoring, and ESG-linked disclosure requirements play a critical role in determining whether green finance translates into measurable sustainability outcomes (ICMA, 2021). Moreover, green bond issuance increasingly serves as a signalling mechanism through which firms communicate commitment to low-carbon transition pathways and cleaner technologies under conditions of market uncertainty (Tang & Zhang, 2020; Flammer, 2021).
Since the launch of the first green bond by the World Bank (WB) in 2008, green bonds have evolved into a major component of global sustainable finance markets by linking debt issuance directly to environmentally beneficial investments (World Bank, 2008). The global green and sustainable debt markets have expanded rapidly, with cumulative climate-aligned sustainable debt surpassing USD 6 trillion by 2025, according to the Climate Bonds Initiative (Climate Bonds Initiative, 2025d). Green bonds alone continue to dominate sustainable debt issuance, accounting for over 60 per cent of aligned sustainable finance markets in 2024 (Climate Bonds Initiative, 2025c). Asia’s green and sustainability bond market has emerged as one of the fastest-growing segments of global sustainable finance, driven by rising climate commitments, renewable energy deployment, and industrial decarbonisation needs. By the end of 2024, Asia accounted for nearly 24 per cent of the global sustainable bond market, with outstanding sustainable bonds issued by Asian companies reaching approximately USD 572 billion (OECD, 2025). China remains the dominant regional issuer, accounting for nearly 43 per cent of Asia-Pacific green funding, followed by Japan, the Republic of Korea, Singapore, and India (Climate Bonds Initiative, 2025c). Hong Kong alone arranged over USD 43 billion in Green, Social, Sustainability, and Sustainability-linked (GSS+) bonds in 2024, representing nearly 45 per cent of Asia’s international sustainable debt market (Climate Bonds Initiative, 2025a). India’s sustainable debt market has also expanded rapidly, with cumulative GSS+ issuance reaching nearly USD 56 billion by the end of 2024, largely concentrated in clean energy, transport, and infrastructure sectors (Climate Bonds Initiative, 2025b). Despite this rapid expansion, Asia’s green bond market continues to face several structural constraints, including fragmented taxonomies, inconsistent disclosure standards, currency risks, limited secondary market liquidity, and concerns regarding greenwashing (OECD, 2025).
The energy sector’s role in the low-carbon transition is pivotal, with the sector’s investment generating disproportionately large economy-wide and environmental spill-overs. Further, globally, this sector also emerges as one of the key sectors driving green and sustainability bonds linked to climate finance. A key component of green bond evaluation is use-of-proceeds (UoP) analysis, which assesses whether funds are allocated to eligible environmental projects. UoP disclosure enhances transparency and investor confidence and supports post-issuance monitoring (Labatt & White, 2002; ICMA, 2023). Yet, it does not ensure environmental additionality, as it may not reflect changes in issuers’ overall emissions or investment behaviour (OECD, 2020; Network for Greening the Financial System (NGFS), 2024). Consequently, third-party reviews, such as second-party opinions, verification, and certification, serve as governance mechanisms that reduce information asymmetry and limit greenwashing (Zerbib, 2019; Flammer, 2021); though differences in review rigour still raise comparability and harmonisation concerns (OECD, 2020).
This article examines the role of green bonds in supporting Asia’s energy transition through a comparative analysis of corporate utility and energy-sector bond investments in China, India, and the Republic of Korea. The three economies represent distinct transition pathways shaped by differing levels of industrial development, financial-market maturity, technological capability, and climate-policy ambition. China leads in renewable-energy manufacturing and green bond issuance, India represents a rapidly expanding renewable-energy market facing developmental and financing challenges, while Republic of Korea pursues technology-intensive transition strategies centred on industrial modernisation and advanced energy systems. Together, these economies provide important insights into how green finance is shaping Asia’s low-carbon transition pathways.
2. Methodology and Analytical Framework
This study employs a multi-regional input-output economy-wide assessment with a comparative analytical approach to examine the allocation of green and sustainability bond finance by corporate entities in the energy and utility sectors across major Asian economies. The analysis provides a cross-sectional overview of how corporate energy & utilities (E&U) bond investment is being distributed across transition-relevant sectors and technologies, while also identifying the distinct strategic priorities, industrial structures, and transition pathways emerging across different geographic contexts. The study focuses on understanding the composition, direction, and strategic orientation of green finance flows, along with direct and indirect economic and emission impacts that further their prospective implications for Asia’s energy transition.
We construct a firm-level, sector-mapped database of green and sustainability bond investments for corporate utilities and energy-sector firms across three major Asian economies. Comprehensive bond-level UoP data are sourced from the International Capital Market Association (ICMA) sustainable bond database hosted on the Luxembourg Green Exchange (LGX) data hub (Luxembourg Stock Exchange, n.d.), which compiles issuer-level information, including issuer name, issuer location, issuer sector, bond type, number of bonds issued, issuance value (USD billion), and the latest external review form. In addition, a detailed use-of-proceeds profile is developed for each bond issuance, using firm-level bond disclosure reports, allocation statements, sustainability reports, annual reports, and ESG disclosures. Bond proceeds are systematically mapped into transition-relevant sectors, such as renewable energy, grid modernisation, energy efficiency, electric mobility, hydrogen systems, climate adaptation infrastructure, and low-carbon industrial technologies. Each observation in the dataset thus represents a unique issuer–bond type combination, enabling cross-country and sector-level comparison of sustainable finance allocation patterns and issuance strategies. The database thus provides a comparative empirical foundation for evaluating how corporate green and sustainability bond markets are shaping technology-specific investment flows and low-carbon transition pathways across Asia’s utility and energy sectors.
The sectoral investment allocations are further integrated within an environmentally extended multi-regional input–output (EE-MRIO) framework based on EXIOBASE 3 to estimate associated domestic and international value-added generation, employment effects, and direct and indirect greenhouse gas emissions embedded across global supply chains (Stadler et al., 2026). In this study, we specifically examine allocation patterns across corporate utility and energy-sector green and sustainability bonds in these three economies to compare how differing institutional structures, financial systems, regulatory frameworks, and corporate governance models shape corporate climate-finance decisions and investment priorities. By focusing on firm-level corporate action and the direct allocation of bond proceeds, we analyse how green finance is being operationalised toward renewable energy, grid modernisation, clean transport, hydrogen systems, and other emerging transition technologies. We further assess the extent to which corporate green bond investments are contributing to structural transformation away from fossil-fuel-intensive energy systems and aligning with broader national decarbonisation pathways. The following section presents the case study findings and key comparative insights emerging from our analysis.
3. Case Studies
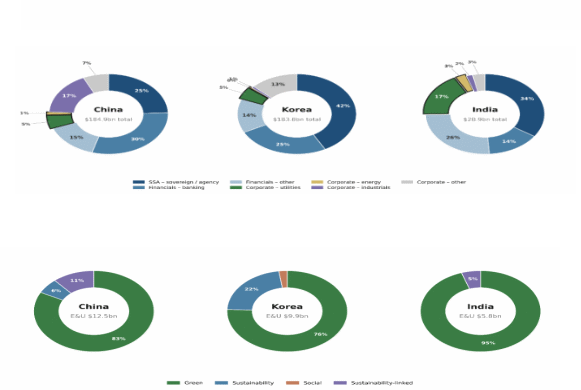
China, the Republic of Korea, and India are among Asia's more substantial issuers in the Energy & Utilities (E&U) segment, and their contrasting industrial structures, ownership models, and trade positions make them an instructive comparative frame for tracing how each of the economies’ climate bond market has varied economy-wide effects in terms of value addition, embedded GHG footprint, and employment. Green bonds dominate across all three economies, particularly in India, where issuance is almost entirely renewable-focused.
Source: Authors’ illustration based on the ICMA database
ROK exhibits a more diversified structure with a relatively larger share of sustainability and social bonds, reflecting broader transition financing priorities under the Korean taxonomy framework (Figure 1). China shows a relatively diversified market structure, while the ROK’s issuance is dominated by sovereign-linked and financial institutions. India displays a comparatively larger share of corporate utility issuers, reflecting the important role of private renewable-energy developers in financing the country’s energy transition. Each of the three markets emerged through a distinct route.
China
China's market was catalysed by the People's Bank of China's green bond guidelines of December 2015, one of the first operational regulatory frameworks for bank and corporate issuance. It triggered a rapid expansion that made China one of Asia's two largest issuers of labelled debt (Escalante et al., 2020). China moved early and on its own terms; its green bonds were, for much of this period, governed in ways that diverged from the international standards, which were taking shape in parallel. Oversight was fragmented across four authorities, each with its own definitions: the People's Bank of China (PBoC) for green financial bonds, the National Development and Reform Commission (NDRC) for green enterprise bonds, the China Securities Regulatory Commission for green corporate bonds, and the National Association of Financial Market Institutional Investors for debt-financing instruments. The treatment of proceeds was comparatively lenient: where the Climate Bonds Standard requires at least 95 per cent of funds to flow to eligible green assets, Chinese rules permitted issuers to channel up to half of their proceeds into repaying bank loans or general working capital (J.-D. Lin, 2023). Furthermore, the taxonomy defined “green” more broadly than the international standards taking shape alongside it, admitting coal washing and higher-efficiency supercritical and ultra-supercritical plants under 'clean utilisation of coal', a category the Climate Bonds Taxonomy explicitly excludes (Liu, 2020). Compounding these gaps, third-party verification remained voluntary and followed no unified certification process, while sustainability disclosure was required only to a limited degree, given that the informational quality of the market was uneven and certain concerns of greenwashing have been in critique (J.-D. Lin, 2023; L. Lin & Hong, 2022). Over the years though, there has been a story of gradual, state-directed convergence and stringency in these norms, propelled by China's 2030/2060 carbon-peaking and neutrality goals; the 2021 Green Bond Endorsed Projects Catalogue unified the fragmented domestic standards and removed fossil-fuel categories from the list of eligible activities. Convergence on the use-of-proceeds followed with the 2022 China Green Bond Principles, which aligned domestic practice with the ICMA framework by requiring that the full proceeds of a green bond be allocated to eligible projects.
The Chinese E&U total sectoral allocation comes to about USD 9.3 billion, in which a major allocation has been towards renewable generation. Wind alone absorbs 40 per cent of proceeds (USD 3.75 billion) and solar photovoltaics a further 22 per cent (USD 2.0 billion); with hydro (7 per cent) and biomass (10 per cent), the four renewable categories together take close to four-fifths. The largest non-generation allocation is to water collection and distribution (12 per cent, USD 1.12 billion), with smaller amounts to gas distribution and nuclear (Table 1).
Table 1: China’s cumulative energy & utilities bond allocation disaggregated sector-wiseTable 1: China’s cumulative energy & utilities bond allocation disaggregated sector-wise
Source: Authors' compilation from firm-level use-of-proceeds database using bond disclosure documents.
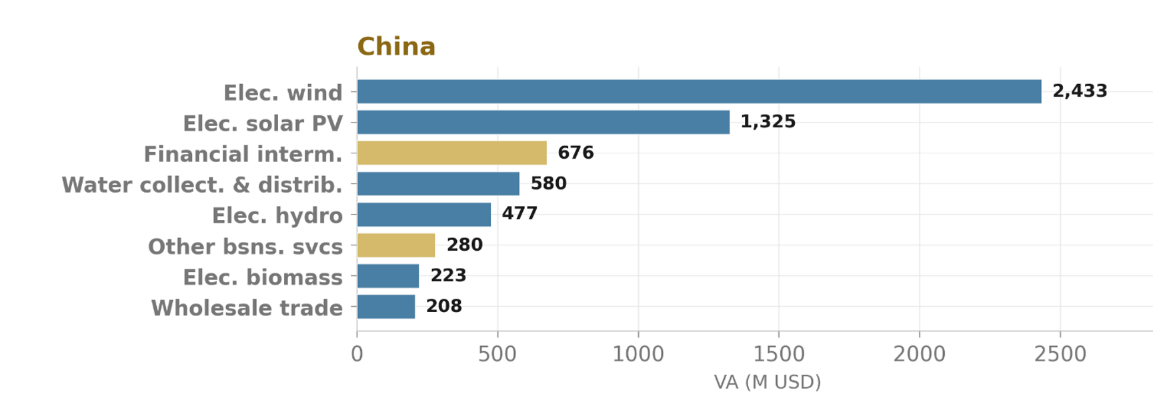
China retains about 89 per cent of the associated value added domestically, the highest share of the three economies in our study. As it’s the manufacturing base for many of the renewable sector required components and materials, it retains that value largely in the funded sectors themselves: electricity by wind contributes the single largest block of domestic value added (USD 2,433 million), followed by solar (USD 1,325 million), water collection and distribution (USD 580 million) and hydro (USD 477 million), while financial intermediation is notable among the top five value-added sectors indirectly (Figure 2).
Source: Authors’ illustration of EE-MRIO analysis using EXIOBASE 3
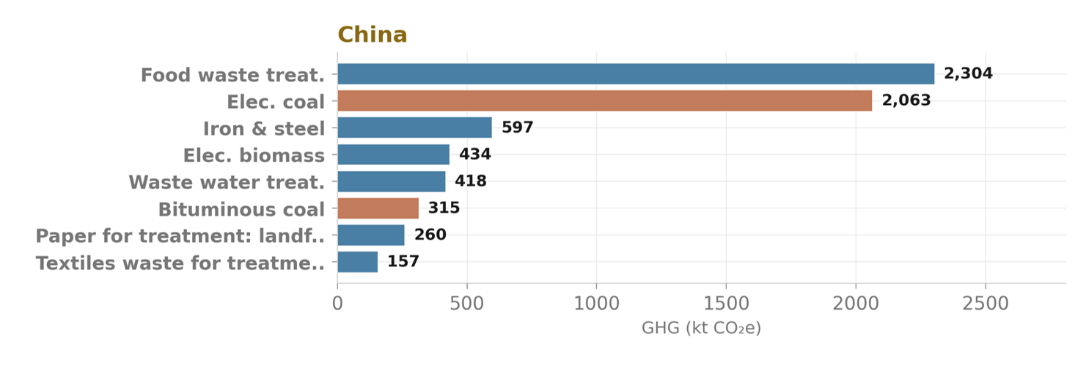
China manufactures the turbines, modules, and structural inputs a renewable build-out consumes; the demand the bond creates is met within its own borders, and the value it generates accrues to the generation assets it finances rather than leaking into an import dependency. The emissions panel tells a different and more revealing story, as the GHG footprint does not arise from the wind and solar activity that the bond funds directly. Rather, the largest domestic emission sources are from food-waste treatment (around 2,304 ktCO₂e), followed closely by coal-fired electricity (2,063 ktCO₂e), and iron and steel (597 ktCO₂e) (Figure 3).
Source: Authors’ illustration for EE-MRIO analysis using EXIOBASE 3
The renewable-electricity sectors are not themselves demanding of the upstream economy, wind’s backward linkage being 0.81 and solar’s 0.95, both at or below the economy-wide average, but their effects are seen through the forward linkages, electricity being a near-universal input. Building and connecting new capacity in the renewables, instead, draws on construction, electrical machinery, and basic steel, and decisively on coal-fired power, which combines a high backward linkage (1.37) with the broadest forward reach in the system (1.45) and so transmits its emissions across the entire production network. These are markers of the transitioning economy that’s aggressively building clean capacity inside a supply chain still anchored in coal, heavy industry, and methane-intensive waste services. Around 85 per cent of the emissions arise domestically, the overwhelming majority of them through the indirect sectoral demands.
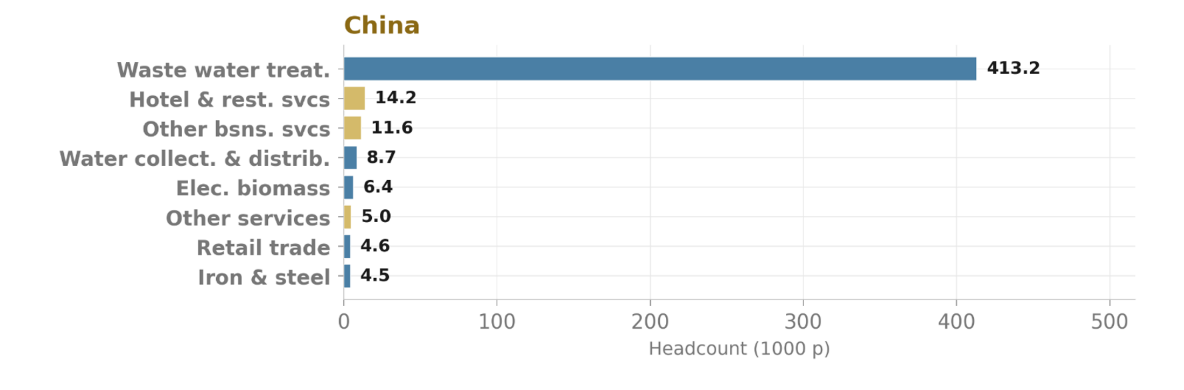
The employment results reflect wastewater treatment as the dominant labour-absorbing sector, with hospitality, business, and water-collection services as resultant indirect effects. Trailing far behind are the renewables themselves, employing comparatively few directly. Thus, 12 per cent of proceeds directed to water and waste, in other words, account for the bulk of both the bond’s domestic emissions and its domestic employment. Hence, the renewables as such are not among the top employing sectors directly.
Source: Authors’ illustration of EE-MRIO analysis using EXIOBASE 3
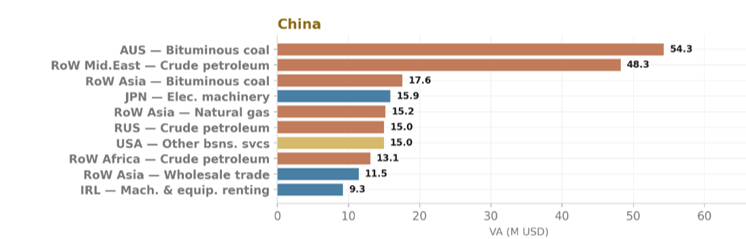
China’s external footprint is correspondingly contained and diffuse. Only about a seventh of the embodied emissions surface abroad, and it is spread thinly across fuel suppliers rather than concentrated on any single partner: the largest cross-border emission flows are Indonesian and other Asian bituminous coal (144 and 106 ktCO₂e), Middle Eastern crude petroleum (102 ktCO₂e) and Russian coal, with the corresponding value-added leakage flowing to Australian and Asian coal and to Middle Eastern crude (Figure 5).
Source: Authors’ illustration of EE-MRIO analysis using EXIOBASE 3
The domestic renewable projects are reliant on the region’s coal and oil-linked primary sectors, but, as such, China has internalised the value addition as well as its GHG footprint within the domestic economy, compared to Korea and India. This is the dividend of an industrial base complete enough to supply most of its own transition; thus, the bonds are effectively addressing both climate finance and industrial policy.
India
India issued its first green bond in February 2015, when Yes Bank raised INR 10 billion through a green infrastructure bond to finance renewable energy projects (Darby, 2015); later that year, in a first of its kind, the International Finance Corporation (IFC) issued an offshore rupee-denominated 'green masala' bond, opening a parallel channel for mobilising international capital toward domestic climate goals (IFC, 2016). The market deepened over the following decade through issuance by privately held renewable developers and by public-sector banks and state financing agencies, such as REC Limited, the Power Finance Corporation and the Indian Renewable Energy Development Agency, with further support through the Reserve Bank of India's inclusion of renewable energy within priority-sector lending. The regulatory architecture tightened in step: the Securities and Exchange Board of India first issued disclosure norms for green debt securities in 2017, mandating minimum use-of-proceeds and reporting standards, and revised them in 2023 to require independent third-party review at both the pre- and post-issuance stages (Damodaran & van den Heuvel, 2023). India’s E&U segment is all concentrated in renewables, primarily in solar (47.4 per cent) and wind (34.3 per cent) projects, followed notably by hydro (17.9 per cent), mostly all under a build-own-operate model backed by both foreign (ReNew, Continuum) and domestic capital (JSW, Adani, SAEL); the average bond size is among the lowest reflecting a still nascently emerging segment.
Table 2: India’s cumulative energy & utilities bond allocation disaggregated sector-wiseTable 2: India’s cumulative energy & utilities bond allocation disaggregated sector-wiseThe Indian E&U total sectoral allocation comes to about USD 3.9 billion, the smallest of the three cases and is directed almost entirely to renewables; solar photovoltaics absorb 47 per cent of proceeds (USD 1.85 billion) and wind a further 34 per cent (USD 1.34 billion), with hydro (18 per cent, USD 0.70 billion) and a minor but notable allocation into electricity through biomass.
Source: Authors' compilation from firm-level use-of-proceeds database using bond disclosure documents.
The issuance is almost entirely green-labelled, and the issuer base is privately held, with the developers building, owning, and operating the assets under a Build-Own-Operate (BOO) basis. The project aims toward long-term offtake to the state distribution utilities, with foreign (ReNew, Continuum, Greenko) and domestic (JSW, Adani, SAEL) capital alongside the public Indian Renewable Energy Development Agency.
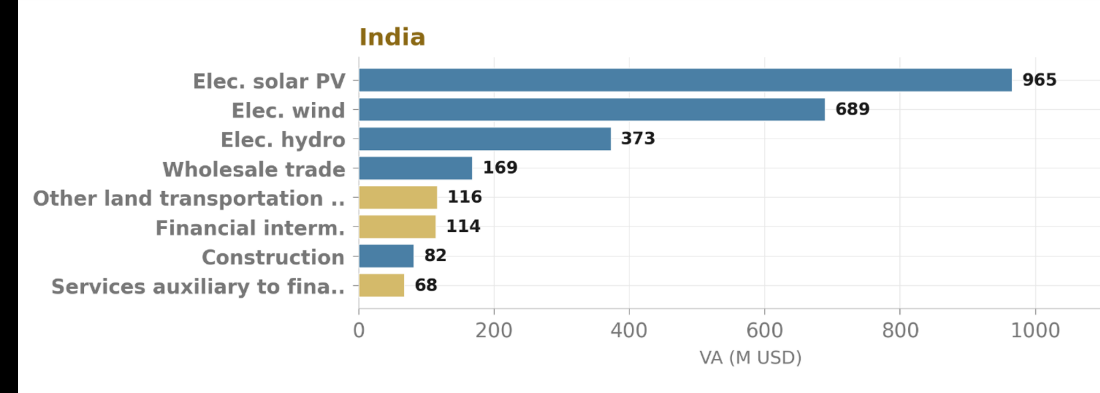
India retains about 73 per cent of the associated value addition domestically, the lowest share of the three economies in our study. The value it does retain lands first in the directly allocated renewables sectors themselves, solar photovoltaics contributing the largest block (USD 965 million), followed by wind (USD 689 million) and hydro (USD 373 million), and then by wholesale trade, transport, and financial services through indirect associated sectors. The comparatively lower domestic retention reflects the import dependency of the renewables sector in India. Thus, although the funded sectors carry above-average backward linkages with the domestic economy (solar 1.24, wind 1.15), the upstream sectoral demand they generate is largely met through foreign supply chains rather than domestic supplies.
Source: Authors’ illustration of EE-MRIO analysis using EXIOBASE 3
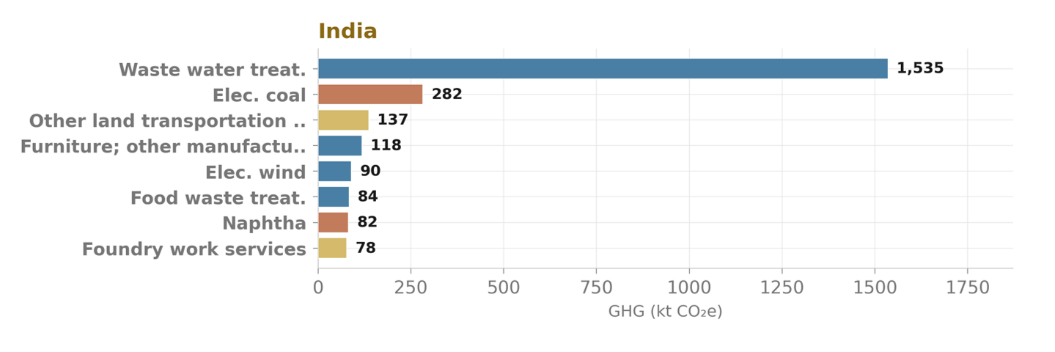
The GHG footprint does not arise from the allocated renewables but rather, akin to the case of China, it’s from wastewater treatment, accounting for the largest domestic emission source (around 1,535 ktCO₂e), a methane-intensive service. This is followed by coal-fired electricity that still energises the grid and the supply chain for the ancillary supporting service sector (282 ktCO₂e). The remainder of emissions is through road transport (137 ktCO₂e), miscellaneous manufacturing and furniture (118 ktCO₂e), the wind generation itself (90 ktCO₂e) and food-waste treatment (84 ktCO₂e). Naphtha appears among the emission sources (around 82 ktCO₂e) for a less obvious reason worth tracing. As a refinery product, it enters the renewable supply chain on two paths: as a petrochemical feedstock for the plastics, resins, and insulation embodied in cabling, mounting structures, and balance-of-system components; and as part of the refined-petroleum stream that fuels the transport. Refined-petroleum products occupy a high-forward-linkage position in the Indian economy, feeding transport and petrochemicals across nearly every sector, so even the modest material and fuel demand a solar and wind programme places on them pulls measurable naphtha refining into activity, carrying its process and combustion emissions with it. Indian electricity through coal, as such, carries a below-average backward linkage (0.85), so its emissions propagate less widely through the production network than China’s coal power does.
Source: Authors’ illustration of EE-MRIO analysis using EXIOBASE 3
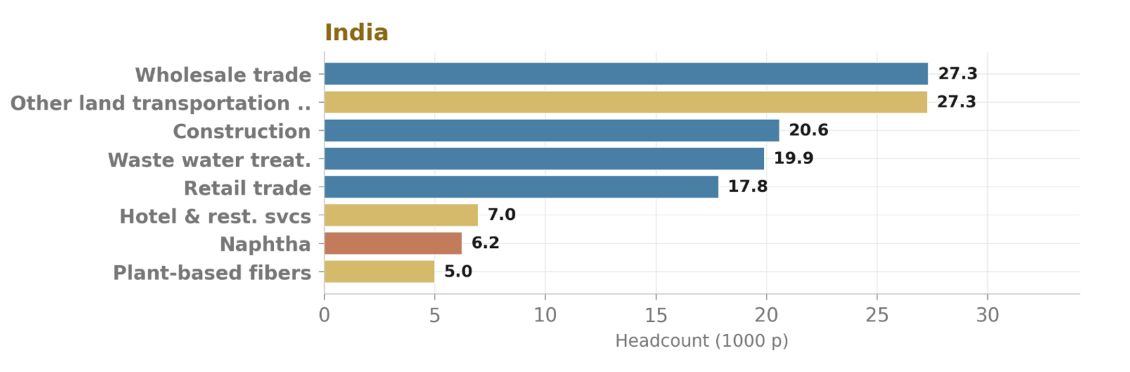
The employment results are the most pronounced of the three cases, with the bond’s labour absorption per unit of finance being the highest, distributed across labour-intensive sectors. Wholesale and retail trade, road transport and construction, together with the water and waste services, dominate, while the renewables again employ comparatively few directly.
Source: Authors’ illustration of EE-MRIO analysis using EXIOBASE 3
The pattern is structurally reflective of low labour productivity as it is clustered around mostly sectors with higher occupational informality. The same thinner value retention that limits India's domestic capture turns each unit of green finance into a disproportionately large, if informal, employment effect, absorbed through trade, transport, and construction services through the build-out. Naphtha reappears here too, absorbing around 6,200 jobs, the labour counterpart of the refining and petrochemical activity traced above.
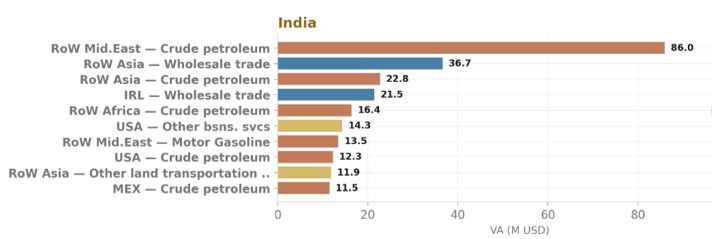
India’s external footprint is the largest of the three, with about 27 per cent of the associated value addition surfacing abroad. The leakage is concentrated in the imported petroleum supply chain: Middle Eastern crude petroleum is the single largest cross-border flow in both value addition and embedded GHG footprint, followed by crude from the rest of Asia and Africa and by refined products such as motor gasoline and refinery feedstocks, reflecting the imported oil that fuels the transport, handling, and petrochemical inputs the construction draws upon. A further share accrues to wholesale trade and business services in the rest of Asia, Ireland, and the United States, representing the intermediation and financing margins on imported goods.
Source: Authors’ illustration of EE-MRIO analysis using EXIOBASE 3
A smaller but distinct flow originates in the imported hardware itself: the embodied emissions of Chinese coal-fired electricity (around 23 ktCO₂e), together with component manufacturing elsewhere in Asia, are carried into India through the solar modules on which the programme depends. Because India manufactures little of its own photovoltaic hardware, the emissions of producing that hardware are incurred abroad. A measurable part of the GHG footprint of India's domestic renewable transition is thus discharged in the manufacturing economies from which it imports. India is, in this sense, a genuinely green and developer-led bond market, whose value addition and a significant share of GHG footprint are externalised through an import-dependent supply chain.
Republic of Korea
The Republic of Korea (ROK) reached a labelled-bond market by a third route, neither regulator-catalysed like China’s nor developer-led like India’s, but driven by the state-owned power complex itself. Korean issuers first tapped international ESG demand in foreign currency in the 2010s, and subsequently, the Export-Import Bank of Korea issued an overseas green bond in 2013, among the first in Asia (Oh & Kim, 2018). A won-denominated green, social, and sustainability-bond market grew rapidly, intermediated through the Korea Exchange’s dedicated socially-responsible-investment bond segment. The classificatory architecture that followed is comparatively permissive: the Korean Green Taxonomy (K-Taxonomy), finalised in late 2021 and amended through 2022, admits liquefied natural gas as a transitional activity and, contentiously, new and conventional nuclear generation as eligible, and still remains voluntary for issuers (Tachev, 2022). In the E&U segment, the issuer base is mostly dominated by state-owned enterprises: Korea Electric Power Corporation (KEPCO) and its five generation subsidiaries, Korea Hydro & Nuclear Power, the Korea Gas Corporation and the Korea District Heating Corporation, together accounting for the bulk of the segment with private refiners and independent power producers (the GS, SK and Hanwha group entities) forming a smaller group. In contrast to China and India, wherein the top priority sectors are in renewables, a majority of the Korean green bond proceeds are allocated to financing for liquefied natural gas (LNG) projects and the construction and completion of nuclear power plants.
The Korean E&U total sectoral allocation comes to about USD 10.8 billion, the largest of the three, but unlike China and India, only a small fraction has been allocated towards renewables. Wind and solar together account for under four per cent of proceeds; the bulk is directed instead to construction (23 per cent), gas-fired generation (19 per cent), nuclear capacity (15 per cent), electrical machinery (15 per cent), and the transmission-and-distribution grid (around 15 per cent combined). The allocation reflects the breadth that the K-Taxonomy permits. As such, in the case of ROK, the bond portfolio is dominated by a single state utility family financing the modernisation of an entire power system, generation, network, and the capital goods that build them, rather than new renewable capacity.
Table 3: Republic of Korea’s cumulative energy & utilities bond allocation disaggregated sector-wiseTable 3: Republic of Korea’s cumulative energy & utilities bond allocation disaggregated sector-wise
Source: Authors' compilation from firm-level use-of-proceeds database using bond disclosure documents.
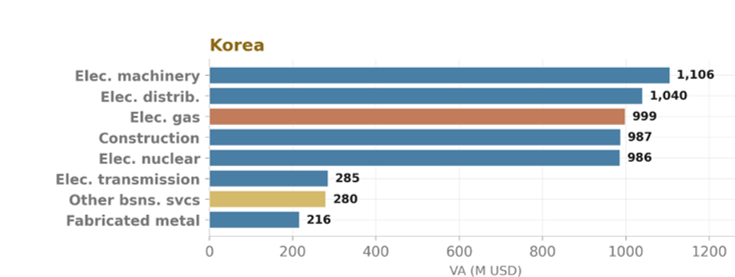
ROK retains about 77 per cent of the associated value addition domestically, below China’s 89 per cent. The lower retention reflects an advanced economy that nonetheless imports much of its primary energy, along with certain major heavy inputs.
Source: Authors’ illustration of EE-MRIO analysis using EXIOBASE 3
The value it retains is not through power generation directly but through supporting capital-goods and infrastructure sectors that build and connect it; electrical machinery contributes the largest block of domestic value addition (around USD 1.1 billion), followed by electricity distribution, gas, construction, and nuclear, each near USD 1.0 billion. The domestic benefit is captured in the ROK’s equipment and engineering base.
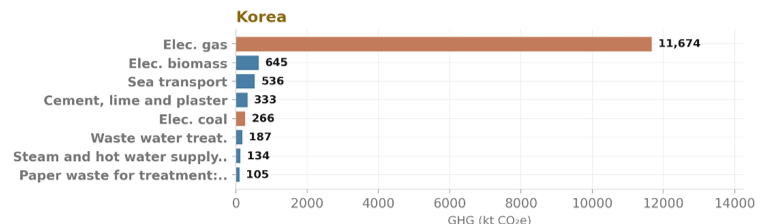
The GHG footprint is where ROK departs most sharply from the other two, and where the permissive or broad considerations under the K-Taxonomy are reflected through the embedded emissions. The most GHG-intensive of the three by a wide margin is ROK, and the reason is structural rather than incidental, as close to a fifth of bond proceeds finance gas-fired power generation. The bonds fund a combustion asset directly, so that the emissions arise not in the upstream supply chain but at the point of use. Domestic emissions are overwhelmingly concentrated in gas-fired electricity (around 11,700 ktCO2e), an order of magnitude above any other domestic source. The gaseous-fuel distribution sector, carrying a high forward linkage (1.65), transmits the GHG footprint further across the production network. Where China’s GHG footprint is the indirect marker of building or expanding the renewables sector within a coal-anchored supply chain, the ROK’s is the direct combustion emission of the gas plants, as its taxonomy permits it as a transitional “green” activity.
Source: Authors’ illustration of EE-MRIO analysis using EXIOBASE 3
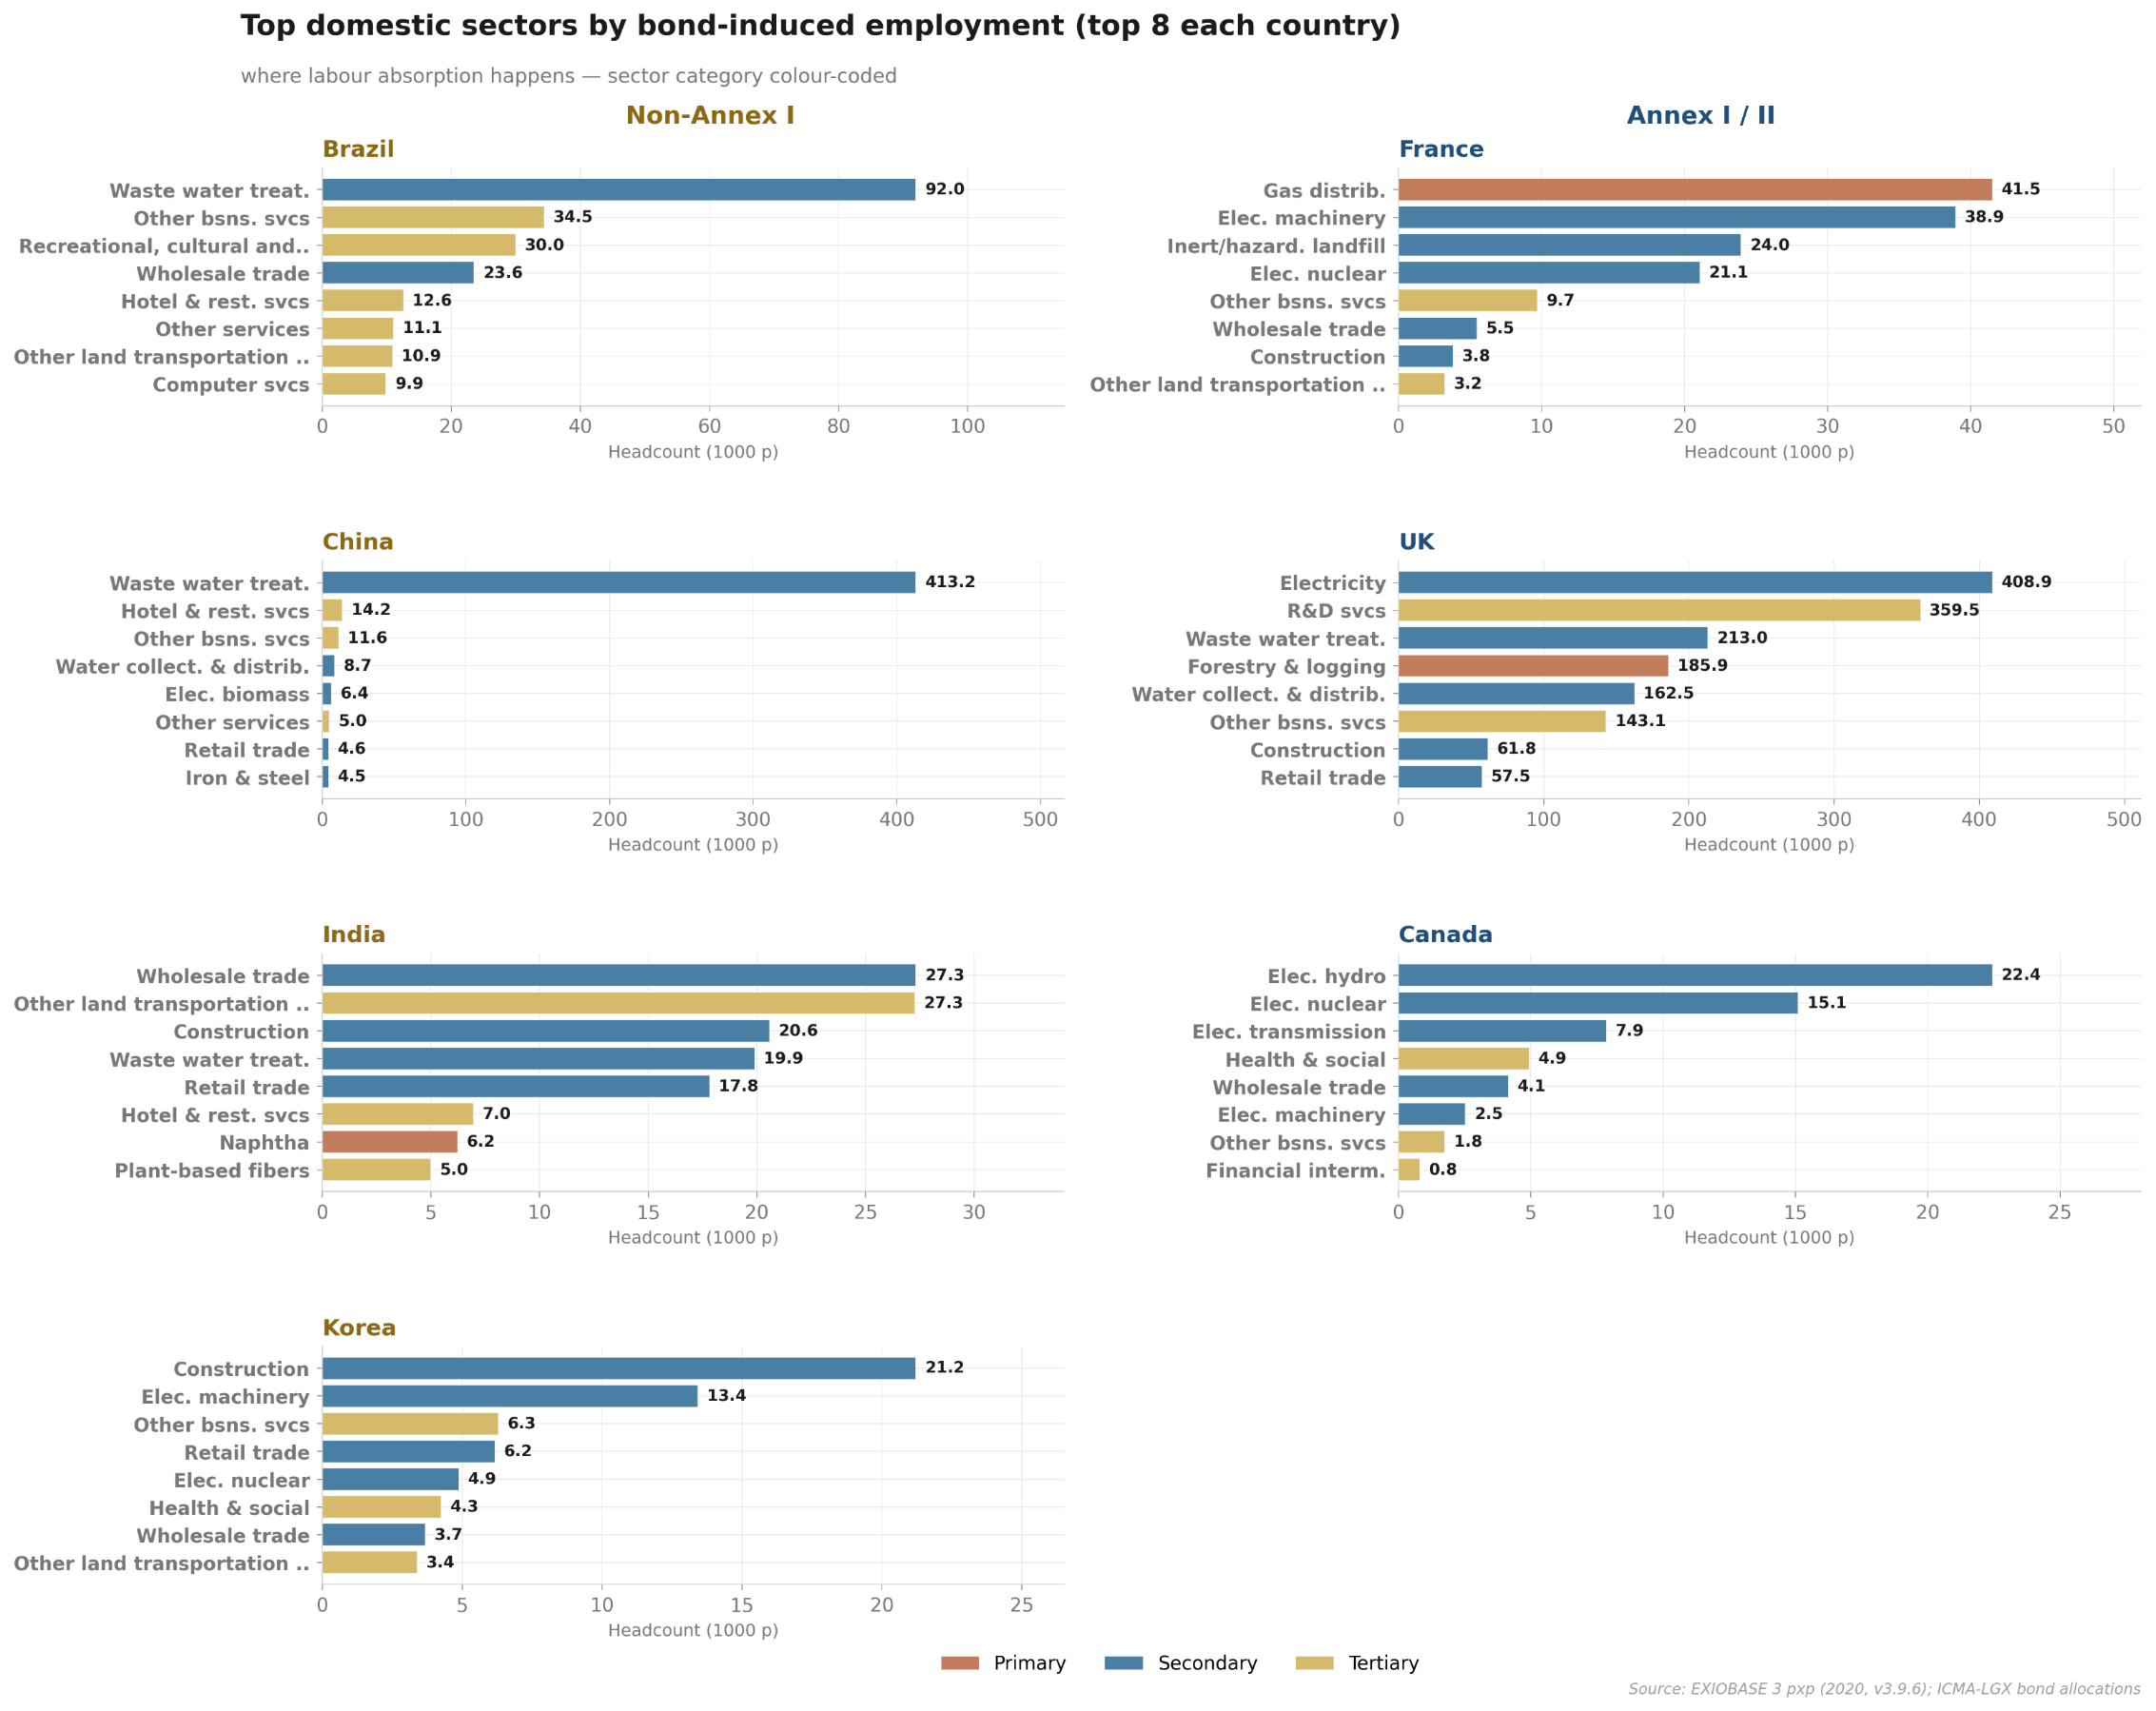
The employment results are the weakest of the three. The bond’s labour absorption per unit of finance is the lowest, concentrated in construction and electrical machinery, with a modest services sector impact.
Source: Authors’ illustration of EE-MRIO analysis using EXIOBASE 3
In a high-income economy with high labour productivity, a unit of green finance supports proportionally fewer jobs, and the developmental dividend ROK draws from the instrument is technological and infrastructural rather than employment-generating.
Source: Authors’ illustration of EE-MRIO analysis using EXIOBASE 3
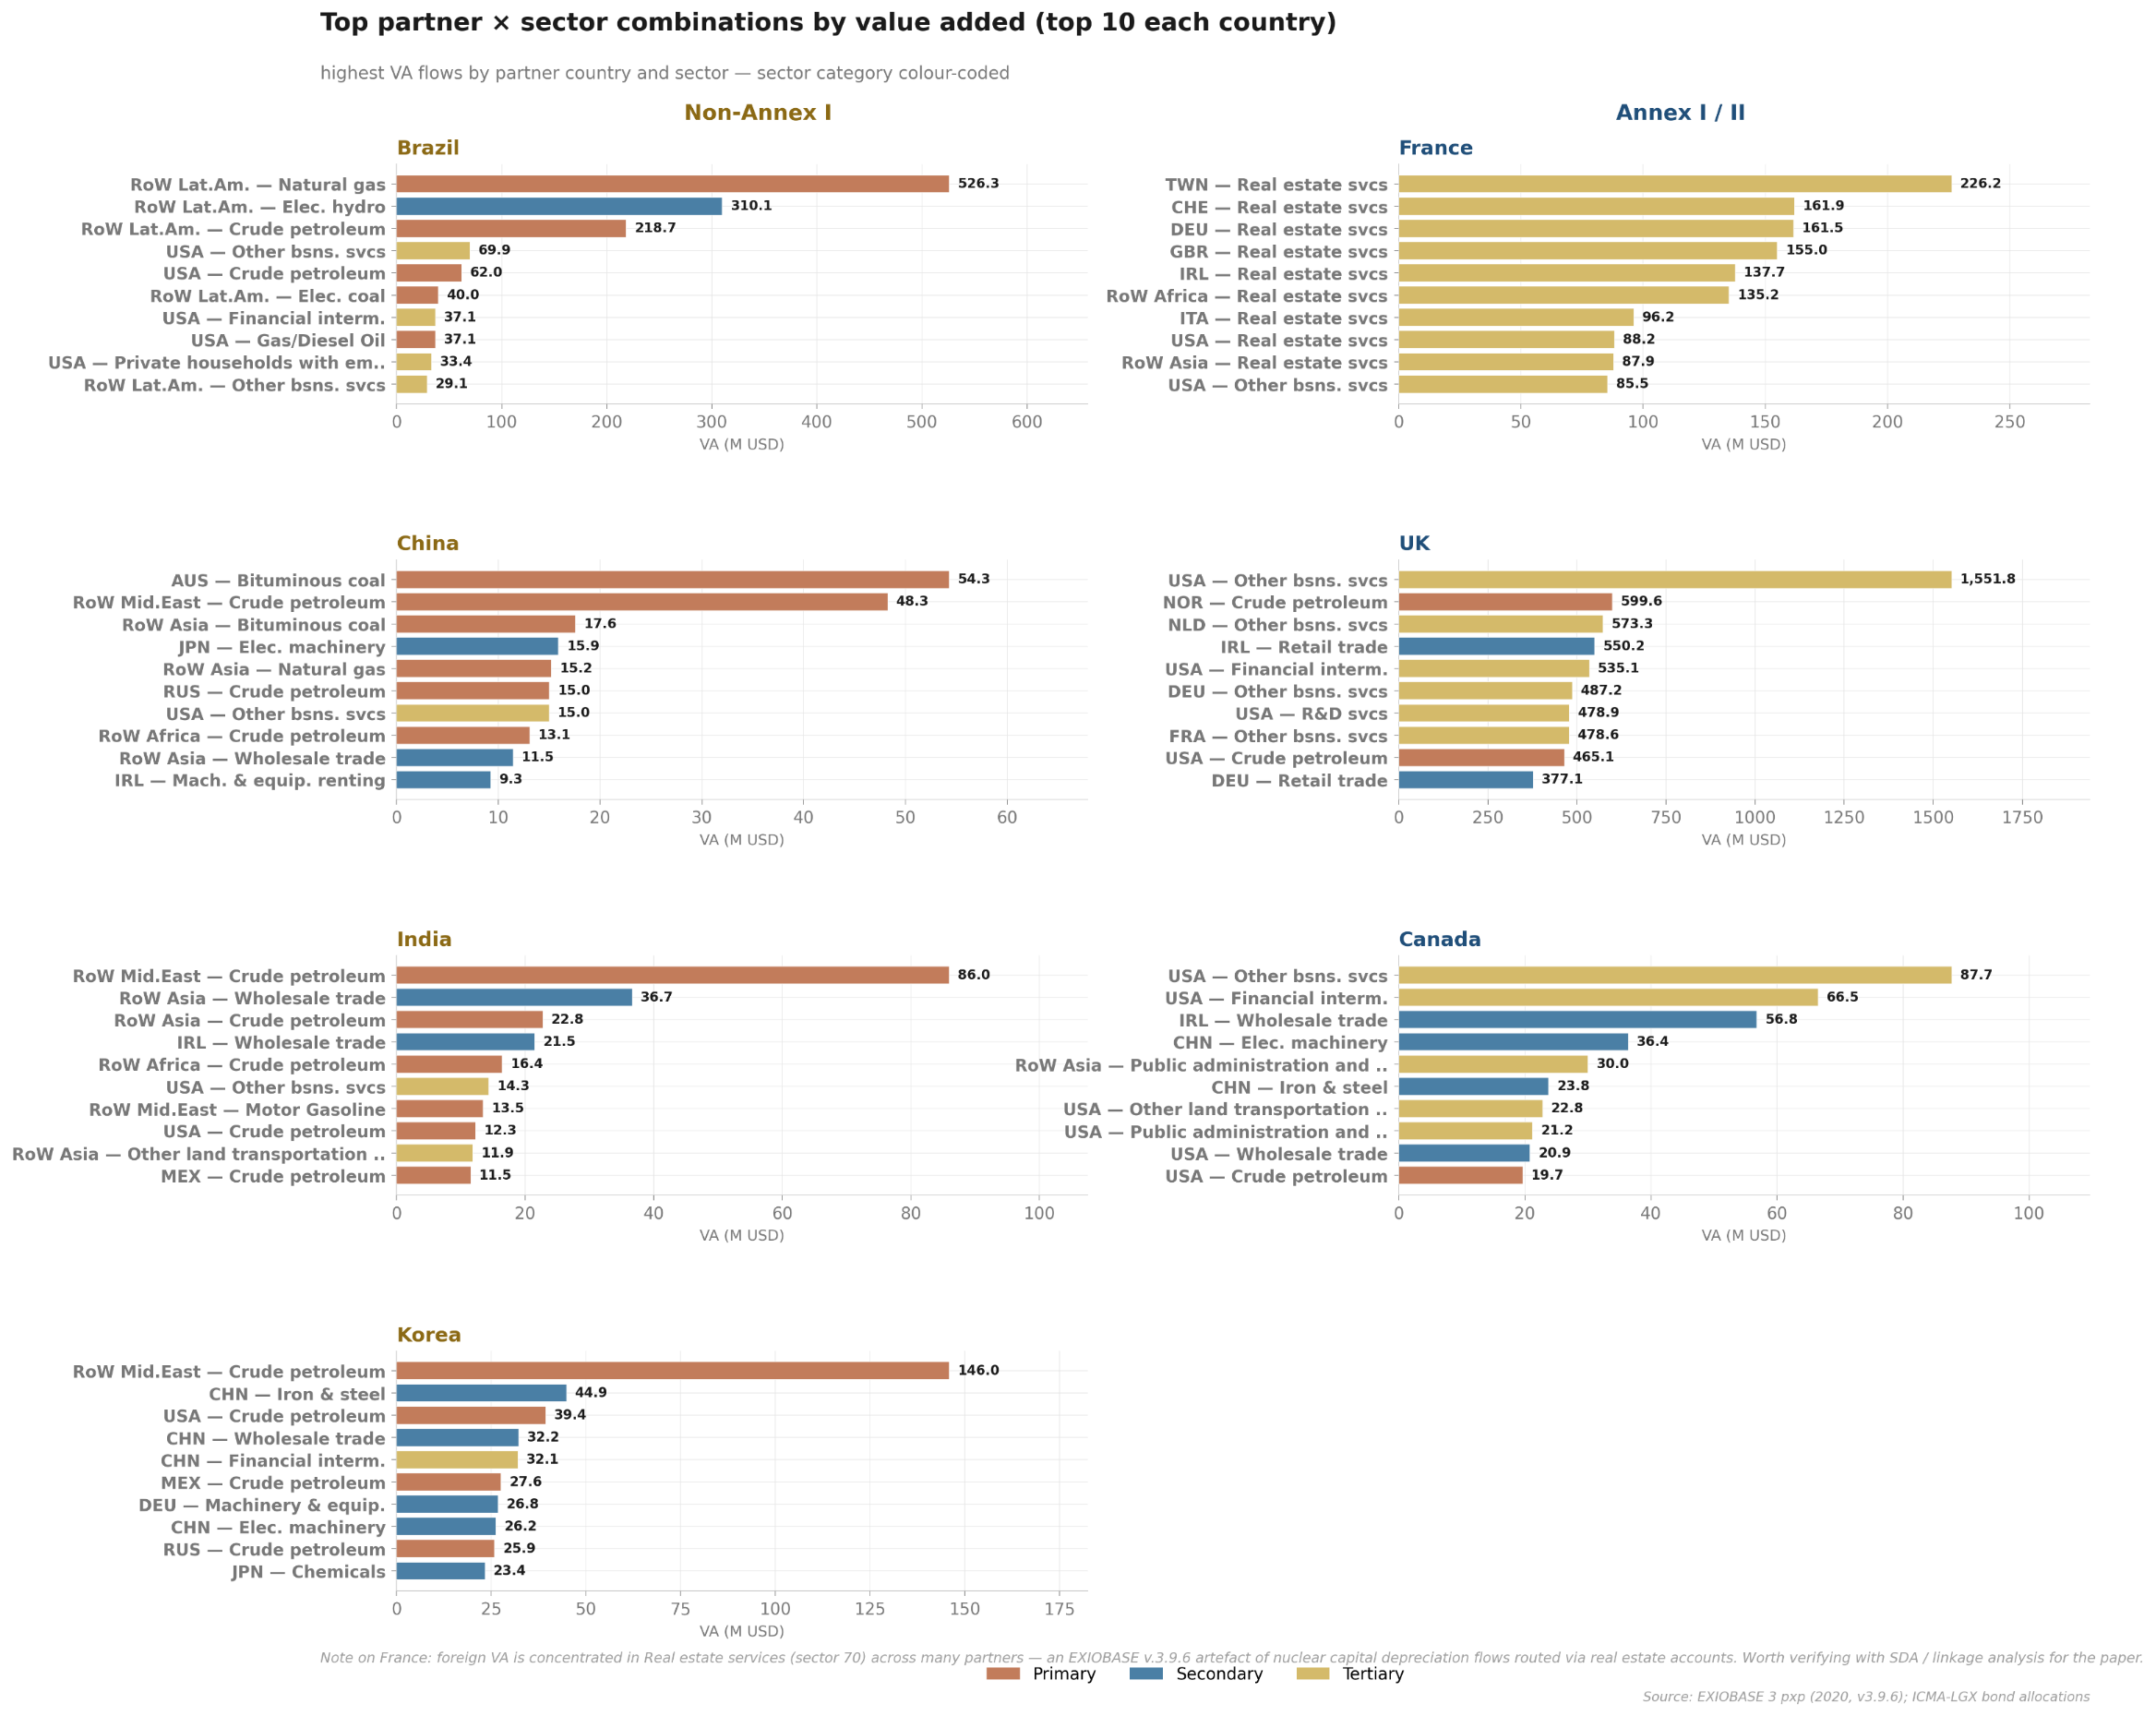
ROK’s external footprint is larger and more concentrated than China’s: close to a quarter of the associated value addition and a substantial share of the embodied GHG footprint surface abroad, both tracking ROK’s import dependence. The largest cross-border value-addition flow is to Middle Eastern crude petroleum (around USD 146 million), followed by Chinese iron and steel, wholesale trade, and electrical machinery. The largest cross-border emissions are likewise Middle Eastern crude (around 308 ktCO₂e), Chinese coal-fired electricity (275 ktCO₂e), and Chinese iron and steel (160 ktCO₂e), the GHG footprint embodied in the fuel ROK burns and the steel and equipment it imports to build with. A significant part of the GHG footprint of ROK’s energy transition is thus discharged in China’s coal-fired power stations and the Gulf’s oilfields.
4. Comparative Discussion
The three case studies return three distinct economy-wide signatures with varying implications for the respective economies. Although a unifying theme emerges from consideration of an economy-wide assessment or the varying types and nature of climate bonds, the developmental and environmental footprint of a green bond is neither legible from the label, nor even from the allocation alone. Rather, it follows from the interaction between what the governing taxonomy permits the proceeds to finance and the structure of the
economy through which that finance propagates.
Table 4: Summary of economy-wide results of energy and utilities green bond issuance, China, India, and Republic of Korea.Table 4: Summary of economy-wide results of energy and utilities green bond issuance, China, India, and Republic of Korea.
| Indicator | Republic of Korea | China | India |
|---|---|---|---|
| Total allocation modelled (USD billion) | 10.8 | 9.3 | 3.9 |
| Dominant allocation (share of proceeds) | Construction 23 per cent, Gas 19 per cent, Nuclear 15 per cent, Electrical machinery 15 per cent, Grid ~15 per cent | Wind 40 per cent, Solar 22 per cent, Biomass 10 per cent, Water 12 per cent | Solar 47 per cent, Wind 34 per cent, Hydro 18 per cent |
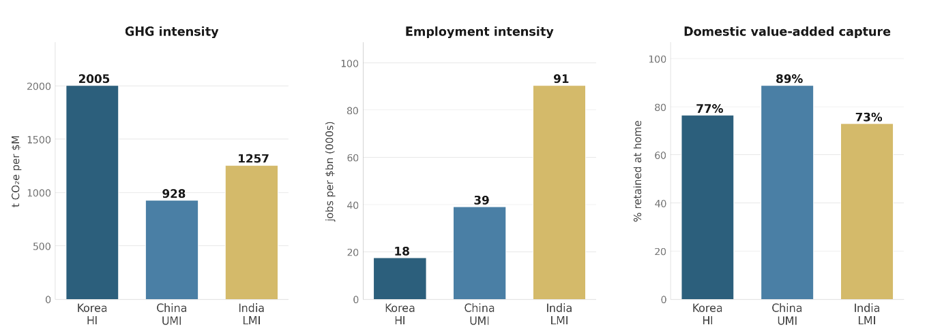
| Domestic value-added capture (%) | 77 | 89 | 73 |
| GHG intensity (tCO₂e per USD million) | 2,005 | 928 | 1,257 |
| Employment intensity (thousand job-years per USD billion) | 18 | 39 | 91 |
| Foreign value added (%) | 23 | 11 | 27 |
| Principal Destinations/ Sectors | Middle Eastern crude, Chinese iron and steel, Chinese coal-fired electricity, Chinese electrical machinery and wholesale trade | Indonesian and other Asian bituminous coal, Russian coal, Middle Eastern crude, Australian coal | Middle Eastern crude, refined petroleum from the rest of Asia and Africa, Chinese coal-power and module manufacturing with a smaller financial-intermediation to wholesale-trade and business services in the rest of Asia, Ireland and the United States |
Source: Authors’ illustration of EE-MRIO analysis using EXIOBASE 3
China captures the largest share, at about 89 per cent, India the smallest, at about 73 per cent, and the ROK sits between them at about 77 per cent. China retains the most because its manufacturing complex supplies most of what a renewable build-out consumes, so that the bond's demand for turbines, modules, and structural inputs is met within its own borders and the value lands in the same renewable-generation sectors it nominally finances. India retains the least because its solar programme is dependent on imported modules and balance-of-system equipment, so that even though the funded sectors carry above-average backward linkages with the rest of the economy, the upstream demand they generate is satisfied through foreign supply chains rather than at home. ROK, despite its high-income status, retains comparatively less than China because it imports almost all of its primary energy and several heavy material inputs, so that its retention takes the form of capital goods, engineering, and construction services rather than generation.
ROK registers the highest GHG intensity at about 2,005 tCO₂e per million dollars of issuance, followed by India, 1,257 tCO₂e, and China, 928 tCO₂e. ROK's emissions arise at the point of use, in the gas-fired generation its taxonomy permits; China's are indirect, transmitted through the coal-fired power, iron and steel, and methane-intensive waste services its renewable build-out draws upon; India's are likewise indirect but propagate less widely through a thinner production network, with a measurable share of its hardware emissions discharged in the manufacturing economies from which it imports.
The geography of the value addition and embodied emissions that surface abroad sharpens the varying implications for the three, 11 per cent for China, 23 per cent for ROK, and 27 per cent for India. China has the least and across the widest set of Asian and Asia-Pacific trading partners; leading cross-border flows accrue to Indonesian, other Asian, and Russian bituminous coal, followed by West Asian crude petroleum, to Australian coal and Japanese electrical machinery, distributed across the Asia-Pacific. ROK's externalisation is intra-Asian but markedly more concentrated, organised along two corridors: West Asian crude petroleum on the energy side, and Chinese iron and steel, coal-fired electricity, and electrical machinery on the materials and capital-goods side. India similarly imports West Asian and African crude on the energy side and Chinese hardware on the materials side, but with a structural addition; the imported solar module components on which the renewable programme depends carry the embodied emissions of Chinese coal-fired electricity into India's own transition. The comparative externalised value addition and embodied carbon of all three economies induced through E&U bonds are retained mostly within Asia and its near energy-supplying partners; what varies between them is the breadth and the structure of intra-Asian supply-chain sectoral dependence.
5. Conclusion
The three economies considered in this study are by United Nations Framework Convention on Climate Change (UNFCCC) convention non-Annex parties, expected under the principle of common but differentiated responsibilities to peak their emissions before declining, thereafter, rather than to cut from a historical base. The pertinent test is, therefore, the credibility of the post-peak trajectory, and towards which the role of climate financing is going to be instrumental in governing the country’s Nationally Determined Contribution (NDC). At present, the NDCs are rated “Insufficient” or worse and all three net-zero strategies “Poor” by the Climate Action Tracker (2025); the sharper distinction lies between near-term (2035) trajectories that appear broadly on course (China, already, aggressively on course) and the longer net-zero pathways that are not. Our economy-wide results supply a third lens that neither the use-of-proceeds label nor the territorial NDC inventory provides.
China’s updated 2035 NDC retains a commitment to peak CO₂ emissions before 2030 and reach carbon neutrality before 2060, and sets a seven-to-ten per cent reduction in economy-wide net greenhouse gas emissions from peak levels by 2035, alongside a thirty per cent non-fossil share in total energy consumption and 3,600 gigawatts of installed wind and solar by 2035, building on the 1,200-gigawatt 2030 capacity goal already met in 2024 (Climate Action Tracker, 2025); the renewable-concentrated bond allocation observed in our sample lands directly within these targets and is, in that sense, the cleanest alignment of the three, although the ambition itself is judged conservative against the roughly thirty per cent reduction analysts associate with neutrality before 2060. India has not committed to a peak at all, and its 2031-2035 NDC, submitted in April 2026, expresses targets instead in terms of a forty-seven per cent cut in the emissions intensity of GDP and about sixty per cent non-fossil installed capacity by 2035, the latter expressly conditional on transfer of technology and low-cost international finance (Government of India, 2026). The solar-and-wind-dominated bond allocation aligns with the capacity target, yet capacity is not generation, and with electricity demand rising and coal output expanding, the non-fossil share of generation remains low: the bond finances clean capacity while the grid it feeds remains the second-largest domestic emission source. ROK is the only one of the three formally past peak, having reached its emissions peak in 2018, and its 2035 NDC, submitted in December 2025, commits to a fifty-three to sixty-one per cent reduction below those 2018 levels by 2035 and to an indicative 2040 coal phase-out announced at COP30 (Climate Action Tracker, 2025); yet against that target, the K-Taxonomy permits an E&U bond programme weighted toward gas-fired generation, nuclear capacity and grid build-out, with renewables a minor share.
The role of the climate finance taxonomy in mediating and aligning respective NDCs is not only understood as a checklist of permissible activities but also as a strategic tool for both economic restructuring and climate policy. Green finance taxonomies have, since China’s first catalogue in 2015, been adopted in most jurisdictions as instruments for building local financial-market transparency and attracting international investors, rather than as domestic policy tools capable of restructuring the economy, the European Union (EU) and China being the principal exceptions where the taxonomy has been threaded through disclosure rules, bond standards and, in China’s case, mandatory guidelines for banks and insurers and pilot zones tied to taxonomy-aligned investment.
The three economies considered here sit at three different phases along this spectrum. China sits closest to the industrial-policy end, with a perimeter cinched around sectors its own manufacturing base can supply, and a 2025 cohort of issuances aligned with the EU-China Common Ground Taxonomy (S&P Global, 2025). India sits at the transparency end, with a green label conceived under SEBI’s disclosure norms (yet to be implemented); the Climate Finance Taxonomy Framework was released in draft for review in 2025 (Department of Economic Affairs, 2025). The proposed taxonomy reserves a continuing role for coal-based thermal power to meet base-load demand, in the intermittency of renewable build-out. The adoption of cleaner coal-generation technologies has been described as a "pragmatic" lower-emission baseload strategy, though no coal-based projects have, so far, been conceived under India's climate bonds issuance. The additionality risks posed by the lack of a well-defined taxonomy and stricter governance of bond UoPs are already visible at the issuer level; a few of the large issuers in our Indian E&U sample faced sustained greenwashing and governance concerns: investigations found value flowing from green subsidiary to coal-linked sister companies within the group, through related-party transactions and the pledging of corporate Green shares as collateral for coal-project financing, alongside a withdrawn dollar bond (U.S. Securities and Exchange Commission, 2026).
India's climate-bond market is still in an emerging phase, but is expected to pick up pace soon, and its developmental momentum will depend upon alignment between the climate finance taxonomy regime and its orientation towards the varied policy dimensions of just transition. The draft Framework describes itself as "a living document" to be reviewed periodically to keep pace with the dynamic landscape, a useful framing in principle, but one that raises concerns of the same shape as the K-Taxonomy's admission of Liquefied Natural Gas (LNG) without any planned phase-out at conception. The integrity of such dynamic framing will depend on whether periodic review moves the taxonomy beyond a transparency device toward a policy instrument for just transition, bolstering domestic manufacturing, grid and storage investment, and the workforce transition the renewable build-out presumes, rather than accommodating the incumbent thermal capacity it is meant to displace.
The Korean Green Taxonomy admits gas-fired generation as a transitional "green" activity through the 2030 to 2035 window, conditional on facility emissions remaining below 340 grams of CO₂e per kilowatt-hour, a threshold materially more permissive than the 270 grams of the European Union's complementary act and one set without the latter's safeguards against carbon lock-in (Tachev, 2022; Ng, 2021). The permissiveness is consequential, as a combustion-based threshold understates the very footprint it is meant to bound, for in lifecycle terms the end-use CO₂ of liquefied natural gas accounts for only about a third of its greenhouse gas footprint, the larger share arising from upstream methane, liquefaction and tanker transport (Howarth, 2024), all of which fall on an economy that imports almost the entirety of its gas.
The economy-wide results we present here show each country's transition reaching into the other’s; the modules that carry India's solar capacity are manufactured on China's coal-fed grid, the steel and the power embedded in Korea's build-out are likewise drawn from its neighbours, and the value and the carbon a green bond sets in motion settle, in good part, across frontiers that neither the use-of-proceeds label nor the territorial inventory is constructed to follow. Alignment, on this reading, is not simply a matter of each country meeting its own target, but of the mutual configuration of the supply chains through which each is bound together. It is here that economy-wide and consumption-based assessment holds its principal promise: by making these interdependencies legible, that is, by tracing where the value lands and where the emissions arise, it offers a more cooperative basis for gauging NDC progress, one in which the manufacturing scale, technology transfer, and regional supply-chain decarbonisation that let these economies support one another become levers of collective alignment.
References · 42 citations
How to cite
Ananya Ajatasatru, Surabhi Joshi, and Kakali Mukhopadhyay (2026). “Financing Asia’s Energy Transition: Role of Climate Bonds in Scaling Emerging Technologies in China, India, and the Republic of Korea.” Asia-Pacific Tech Monitor, Vol. 43, No. 2.
Technology offer
Interested in this technology?
Request further information or explore potential cooperation with the technology provider.
Technology request
Can you help meet this technology need?
Share a relevant technology, expertise or partnership opportunity with APCTT.