

Innovation and Technology for Bioeconomy Transition: Assessing BECCS and e-Fuel Potential from Oil Palm Residues in Southeast Asia

Southeast Asia holds abundant oil palm resources, generating substantial agricultural residues such as palm oil mill effluent (POME). Valorising POME into biogas, biomethane, bioenergy with carbon capture and storage (BECCS), and synthetic fuels (e-fuels) offers a transformative pathway for the regional bioeconomy transition. Utilising remote sensing spatial analysis, Python-based mathematical optimisation modelling, and technoeconomic learning curve evaluations across Baseline, Decarbonisation, and Net Zero scenarios, this study projects resource availability and cost trajectories through 2060. Spatial assessments confirm 23.97 million hectares of oil palm plantations across ASEAN in 2023. By 2060, under the Net Zero scenario, palm oil utilisation supports 116.82 million kilolitres of biodiesel and yields 7,342 million m³ of raw biogas. Biogas upgrading yields 4,588 million m³ of biomethane, which holds a power generation potential of 16.13 TWh of electricity (assuming a lower heating value of 35.8 MJ/m³ and a 35.35% electrical efficiency). Upgrading also isolates 2,754 million m³ of biogenic CO₂ (~5.06 million tonnes of CO₂), enabling permanent negative emissions via BECCS. Integrated power-to-liquid (PtL) 2 catalytic reforming and Fischer–Tropsch synthesis support a regional synthetic sustainable aviation fuel (SAF) potential of up to 36.69 billion US gallons (138.9 billion litres). Technoeconomic modelling demonstrates that learning rate effects will reduce e-SAF production costs from USD 1.20–2.30 per litre in 2025 to USD 0.25–0.77 per litre by 2060, emphasising the necessity of cross-border technology transfer and supportive regulatory frameworks.
- Oil palm residue
- biogas upgrading
- BECCS
- sustainable aviation fuel (SAF)
- Fischer–Tropsch
- Southeast Asia
1. Introduction and Regional Context
The Sixth Assessment Report of the Intergovernmental Panel on Climate Change underscores that global warming will likely cross the 1.5°C threshold in the near term, increasing the frequency and intensity of climate catastrophes (IPCC, 2023). Reaching net-zero emissions requires systemic transformations across energy and industrial sectors. Net-zero energy systems mandate a drastic reduction in unabated fossil fuel combustion, widespread electrification, deployment of zero-carbon power grids, adoption of alternative energy carriers for hard-to-abate applications, and the implementation of carbon dioxide removal (CDR) mechanisms such as bioenergy with carbon capture and storage (BECCS) (IPCC, 2023; Feng & Rosa, 2024).
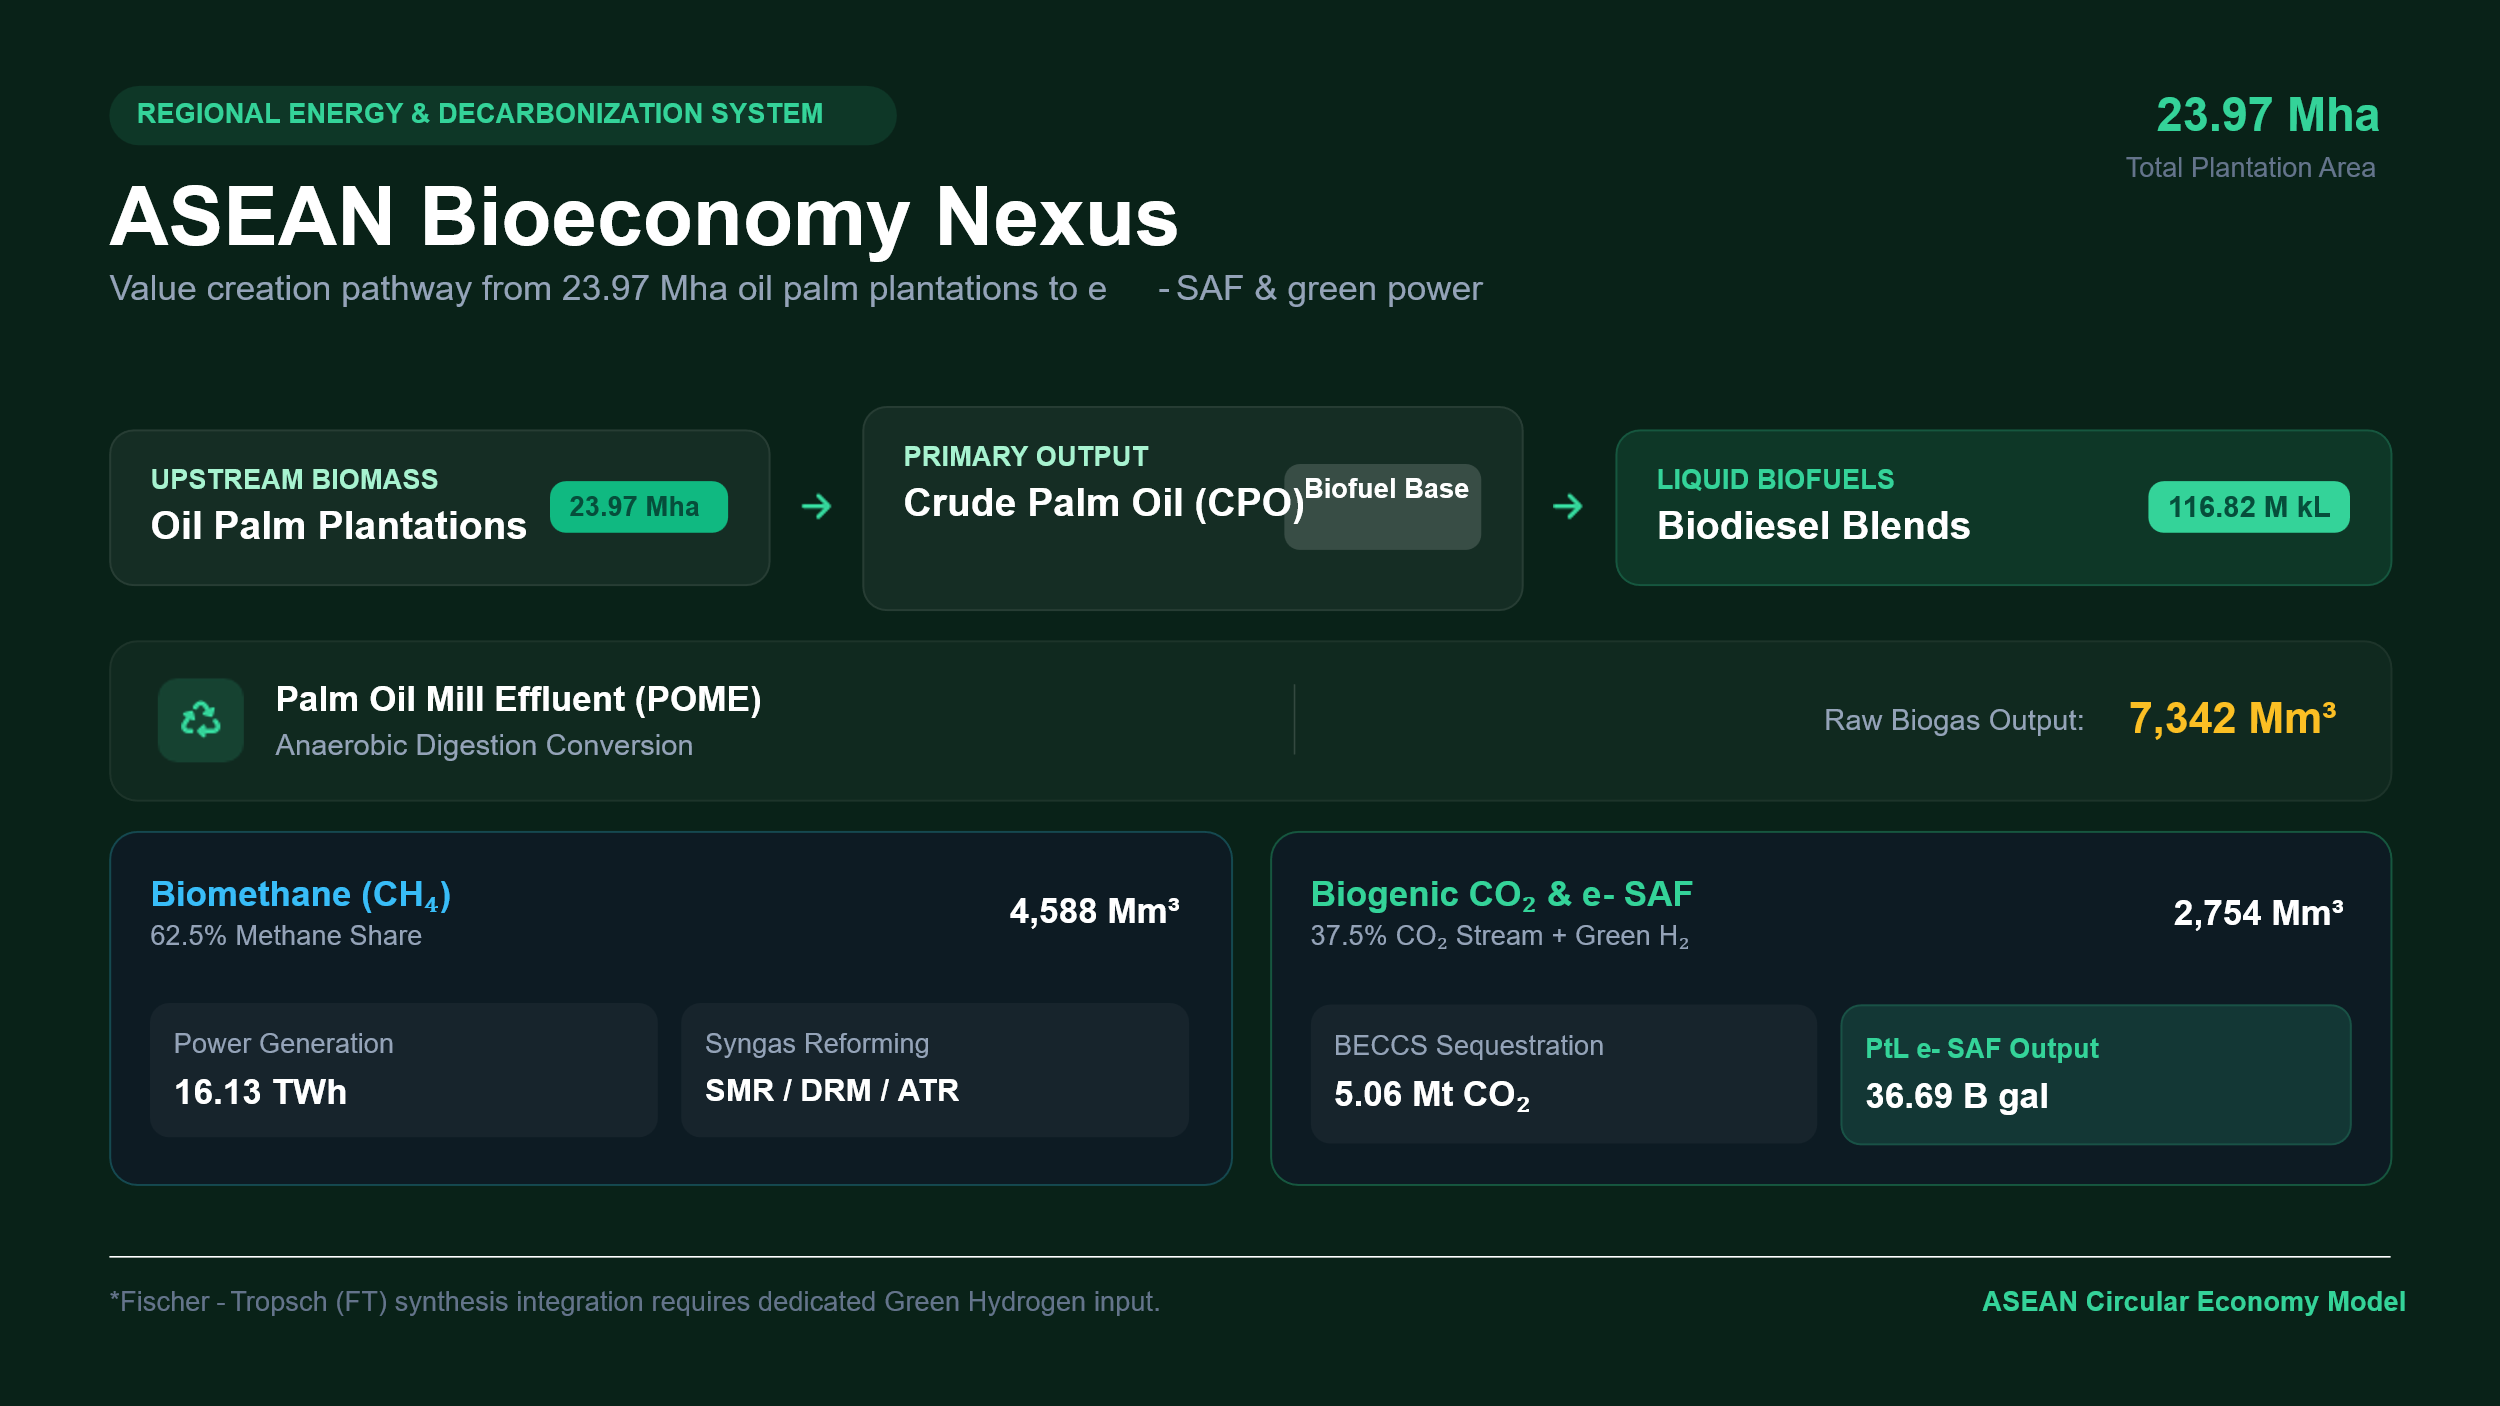
Integrated cascade utilisation of palm oil mill effluent (POME) into biomethane power generation, BECCS carbon removal, and Fischer–Tropsch SAF production pathways.
Southeast Asia is a major hub of global energy growth. According to the International Energy Agency, the region accounted for 11% of global energy demand growth since 2010 and is projected to drive more than 25% of global growth through 2035 (IEA, 2024). Heavy reliance on imported fossil fuels poses severe risks to regional energy security, balance of payments, and environmental sustainability, with energy-related emissions projected to rise by one-third by 2050 without intervention (IEA, 2024).
Renewable energy deployment in Southeast Asia has expanded, with modern bioenergy, geothermal, and hydropower currently constituting 96% of the region’s renewable energy supply (IEA, 2024). Liquid biofuels derived from crude palm oil (CPO)—primarily biodiesel blends in Indonesia, Malaysia, and Thailand—have played a key role in decarbonising transport. However, converting primary agricultural products for energy raises land-use competition between food security and bioenergy. Valorising agroindustrial residues, specifically palm oil mill effluent (POME), presents a highly sustainable alternative. POME processing via anaerobic digestion produces biogas, which can be purified into biomethane (CH₄) for power generation or gas grid injection. Globally, biomethane can offset natural gas demand substantially, including up to 83% in Indonesia and 45% in Thailand (Feng & Rosa, 2024).
Biogas upgrading yields concentrated biomethane and pure biogenic carbon dioxide (CO₂). The biogenic CO₂ stream can be permanently sequestered via BECCS, serving as a negative emissions pathway. Alternatively, biogenic CO₂ or reformed biomethane synthesis gas (CO + H₂) can be combined with green hydrogen derived from water electrolysis to yield drop-in sustainable aviation fuel (e-SAF) via Fischer– Tropsch (FT) Power-to-Liquid (PtL) synthesis or Hydroprocessed Esters and Fatty Acids (HEFA) from lipid residues (IRENA, 2024; Swinbourn et al., 2024). Because waste residues carry zero allocated upstream land-use emissions, e-SAF produced from POME biogas achieves a near-zero lifecycle greenhouse gas footprint (IRENA, 2024).
This study evaluates the long-term regional potential of oil palm residues across Southeast Asia to generate biomethane, negative emissions via BECCS, and synthetic e-SAF. By integrating high-resolution remote sensing, multi-objective optimisation, and technoeconomic learning curves, this paper provides actionable insights for bioeconomy management and regional decarbonisation.
2. Methodology and Modelling Framework
A three-stage analytical framework was established: spatial analysis via remote sensing, mathematical optimisation modelling, and technoeconomic assessment (TEA) employing experience curves.
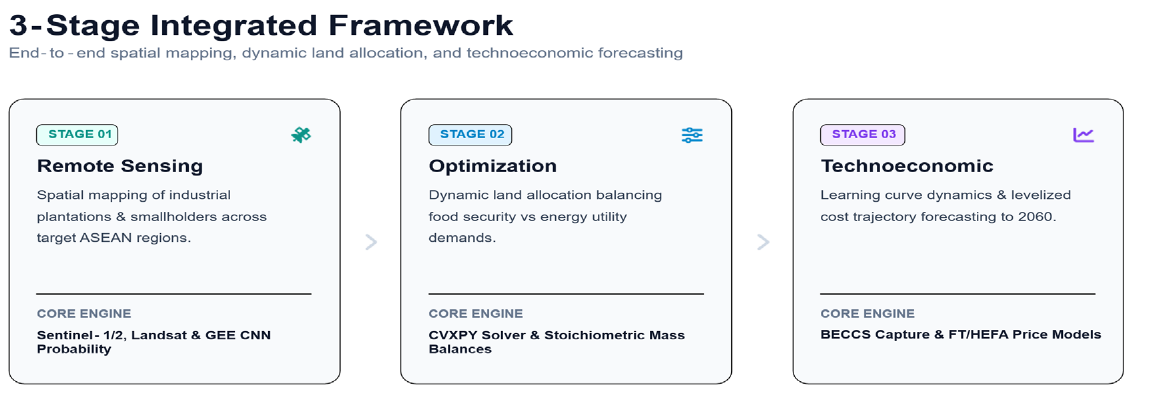
Coupling spatial remote sensing, convex optimisation modelling, and technoeconomic experience curves.
2.1 Spatial Mapping of Oil Palm Distribution
To map oil palm plantations, spatial datasets from Descals et al. (2021, 2024) and Clinton et al. (2024) were integrated. Descals et al. applied Convolutional Neural Networks (CNNs) to Sentinel-1, Sentinel-2, Landsat-5, Landsat-7, and Landsat-8 imagery at a 10-metre resolution, classifying industrial and smallholder plantations globally from 1990 to 2021. Clinton et al. (2024) established a community machine-learning model trained on multi-stakeholder pooled satellite data via the Google Earth Engine platform. A probability threshold of 0.5 was applied to extract palm coverage. Spatial boundary processing and area extractions were executed using ArcGIS Desktop (ArcMap 10.8.2).
2.2 Optimisation Model Formulation
A multi-period numerical optimisation model was constructed in Python 3.12 using the cvxpy convex optimisation package (Agrawal et al., 2018; Van Rossum & Drake, 2002). The objective function maximises the cumulative land allocation utility for food (Afood,t) and energy (Aenergy,t) production over time horizon T (2025–2060):
subject to technical and physical constraints:
Land Availability Constraint:
where Atotal,t = Atotal,0 × (1 + gland)t, with gland representing the annual land growth rate.
Food Demand Constraint:
Biodiesel Volume Constraint:
Biogas Generation and Stoichiometric Separation:
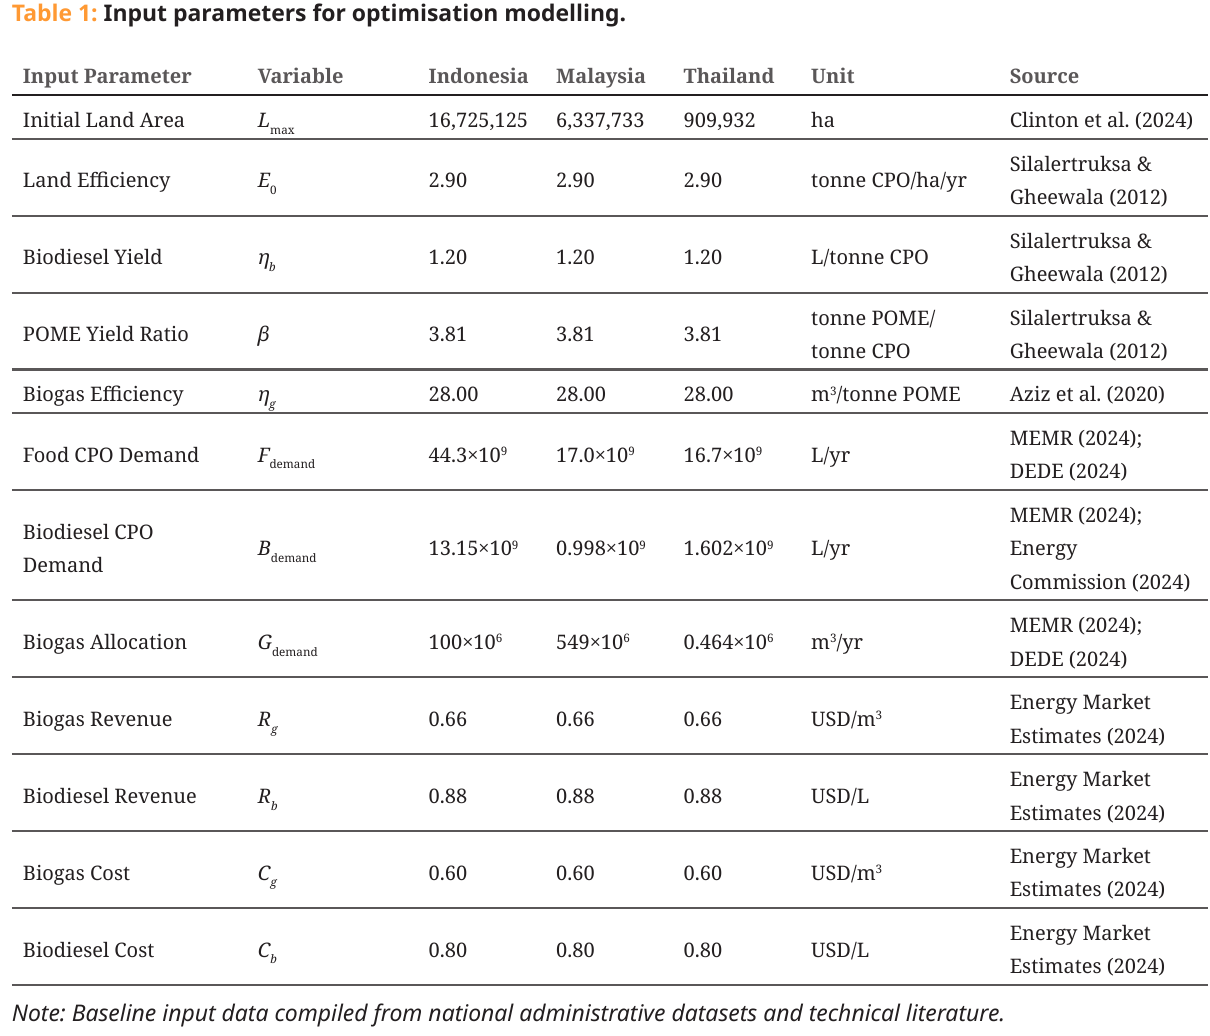
Biogas component separation follows a standardised volumetric model (v/v) derived from Rahayu et al. (2015) and Swinbourn et al. (2024), where raw scrubbed biogas consists of 62.5% methane (CH₄) and 37.5% biogenic carbon dioxide (CO₂):
VCO₂,t = 0.375 · Vbiogas,t
Non-negativity Constraints:
Technological improvements in yields and efficiencies follow compounding growth functions:
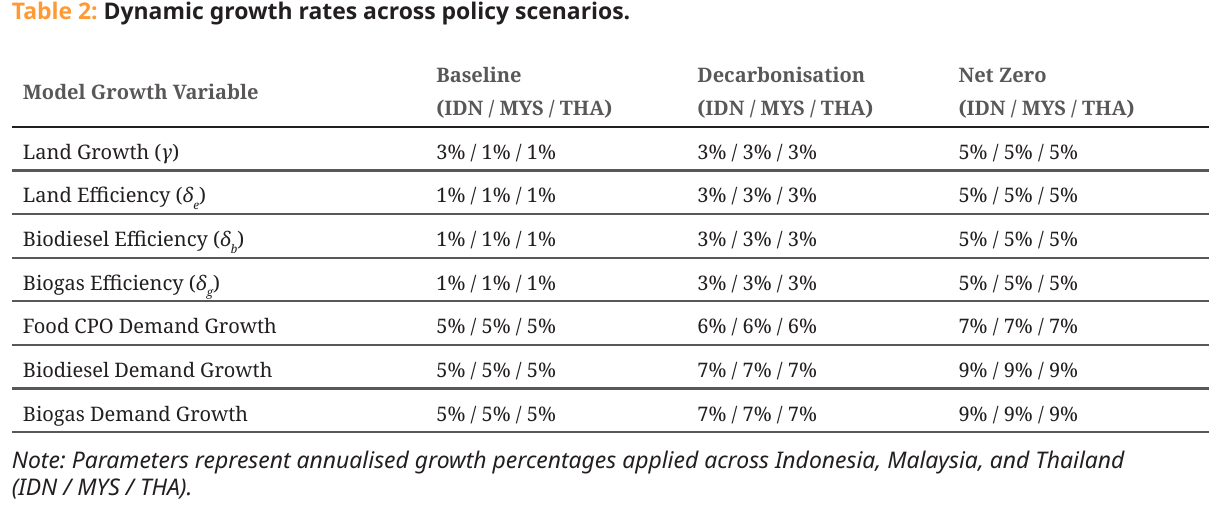
Three policy pathways were evaluated:
- Baseline Scenario: Historical trends (1% annual growth rates).
- Decarbonisation Scenario: Moderate growth (3% annual growth rates).
- Net Zero Scenario: Accelerated policy deployment (5% land/yield growth; 7–9% annual biofuel demand growth).
2.3 Technoeconomic Analysis (TEA) and Learning Curves
Technoeconomic cost trajectories for BECCS capture technologies (Amine Scrubbing [AS], High-Pressure Water Scrubbing [HPWS], Pressure Swing Adsorption [PSA], Membrane Permeation [MP]) and e-SAF conversion technologies (FT and HEFA) were evaluated using single-factor experience curves. Technological unit cost reduction (Pt,s) is modelled as a function of cumulative deployment (Qt):
Pe-SAF,t,s = Pe-SAF,0 × (Qe-SAF,t / Qe-SAF,0)βe-SAF,s
The learning elasticity β relates to the learning rate LR by:
Three sensitivity scenarios were evaluated based on energy technology benchmarks:
- Scenario 1 (0.5 × Solar PV): LR = 11.95%.
- Scenario 2 (1.0 × Solar PV): LR = 23.90%.
- Scenario 3 (1.5 × Solar PV): LR = 35.85%.
3. Results and Discussion
3.1 Spatial Extent of Oil Palm Coverage
Spatial analysis confirms the high concentration of oil palm cultivation in Southeast Asia. Industrial estates represent approximately 60% of total regional acreage, while smallholders manage the remaining 40% (Qaim et al., 2020).
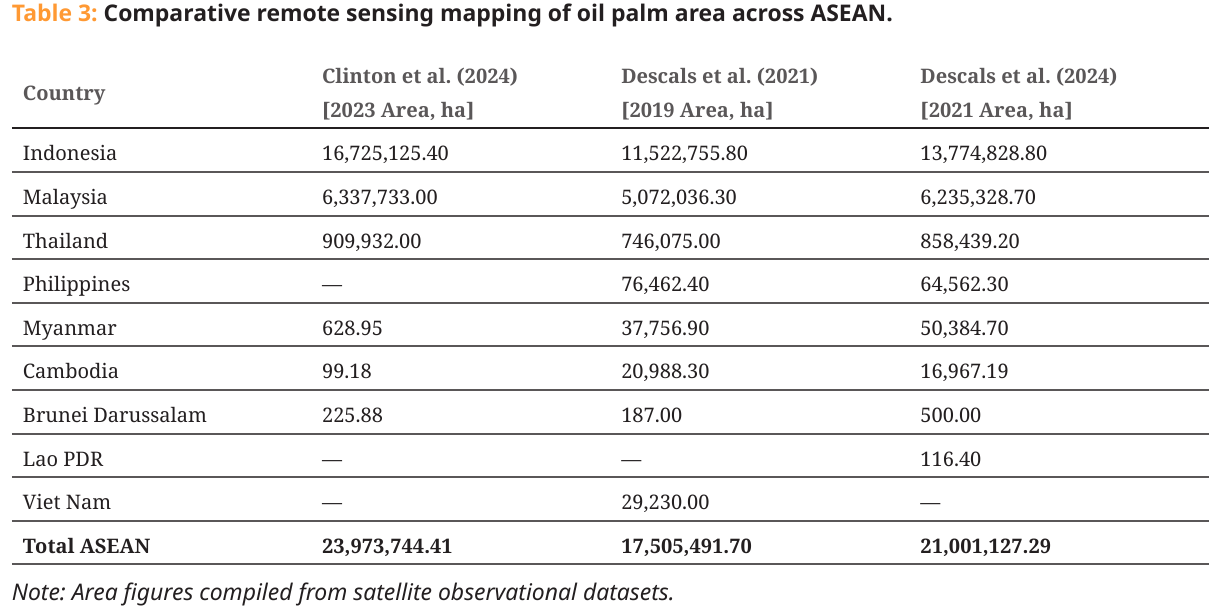
Using Clinton et al. (2024) as the baseline spatial layer, total oil palm plantation area across ASEAN reached 23.97 million hectares in 2023.
3.2 Optimisation Dynamics: Land Allocation
Under the Net Zero scenario by 2060, land allocated for food palm oil in Indonesia stabilises at 3.42 million hectares as agricultural yields improve. Conversely, land dedicated to bioenergy expands:
- Indonesia: Expands from 3.74 million hectares in 2025 to 20.12 million hectares in 2060.
- Malaysia: Expands from 0.34 million hectares in 2025 to 2.74 million hectares in 2060.
- Thailand: Grows from 0.35 million hectares in 2025 to 1.00 million hectares in 2060.
3.3 Biodiesel, Biogas, and Power Potential
Under the Net Zero scenario by 2060, regional biodiesel output reaches 116.82 million kilolitres (98.50 M kL in Indonesia, 13.42 M kL in Malaysia, and 4.90 M kL in Thailand). Concurrently, total raw biogas generation from POME scales up to 7,342 million m³ (5,122 million m³ in Indonesia, 1,941 million m³ in Malaysia, and 279 million m³ in Thailand).
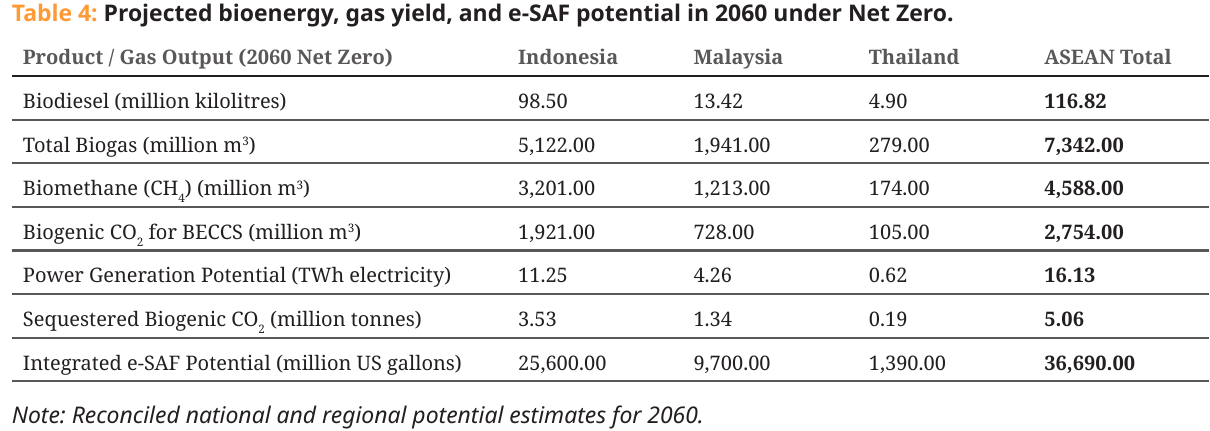
Upgrading this raw biogas yields 4,588 million m³ of pure biomethane (CH₄). Assuming a lower heating value (LHV) of 35.8 MJ/m³ (9.944 kWh/m³), the total thermal energy content is 45.63 TWh. Utilising standard internal combustion or gas turbine combined heat and power systems operating at an electrical conversion efficiency of 35.35%, this biomethane potential yields 16.13 TWh of electricity.
3.4 Biogas Upgrading, Synthesis Gas, and e-SAF Conversion Pathways
To evaluate e-SAF output rigorously, the manuscript distinguishes between four explicit chemical engineering pathways:
- Biogas upgrading and separation. Raw POME biogas (62.5% CH₄, 37.5% CO₂) is scrubbed of trace impurities (H₂S and moisture) and separated into pure biomethane and biogenic CO₂.
- Syngas generation. Biomethane undergoes catalytic reforming: steam methane reforming (CH₄ + H₂O → CO + 3H₂), dry reforming (CH₄ + CO₂ → 2CO + 2H₂), or autothermal reforming. Alternatively, reverse water-gas shift converts biogenic CO₂ (CO₂ + H₂ → CO + H₂O).
- Power-to-liquid Fischer–Tropsch e-SAF. Syngas is catalytically combined (nCO + (2n+1)H₂ → CnH2n+2 + nH₂O) and hydroprocessed into e-SAF. Full regional output of 36.69 billion US gallons (138.9 billion litres) requires external green hydrogen from water electrolysis, approximately 12.8 × 10⁶ tonnes of H₂, and renewable power.
- HEFA pathway. Residual lipid feedstocks (recovered POME oil/sludge and crude palm oil) are hydrotreated, deoxygenated and hydrocracked to produce bio-SAF.
For the biogenic H₂ present in trace process streams (73.2 million m³), mass calculations at Normal Temperature and Pressure (NTP: 20℃, 1 atm, gas density ρ = 0.08375 kg/m³) yield 6,131 tonnes of H₂ (or 6,579 tonnes at STP: 0℃, 1 atm, ρ = 0.08988 kg/m³).
3.5 Technoeconomic Cost Trajectories
e-SAF Production Costs
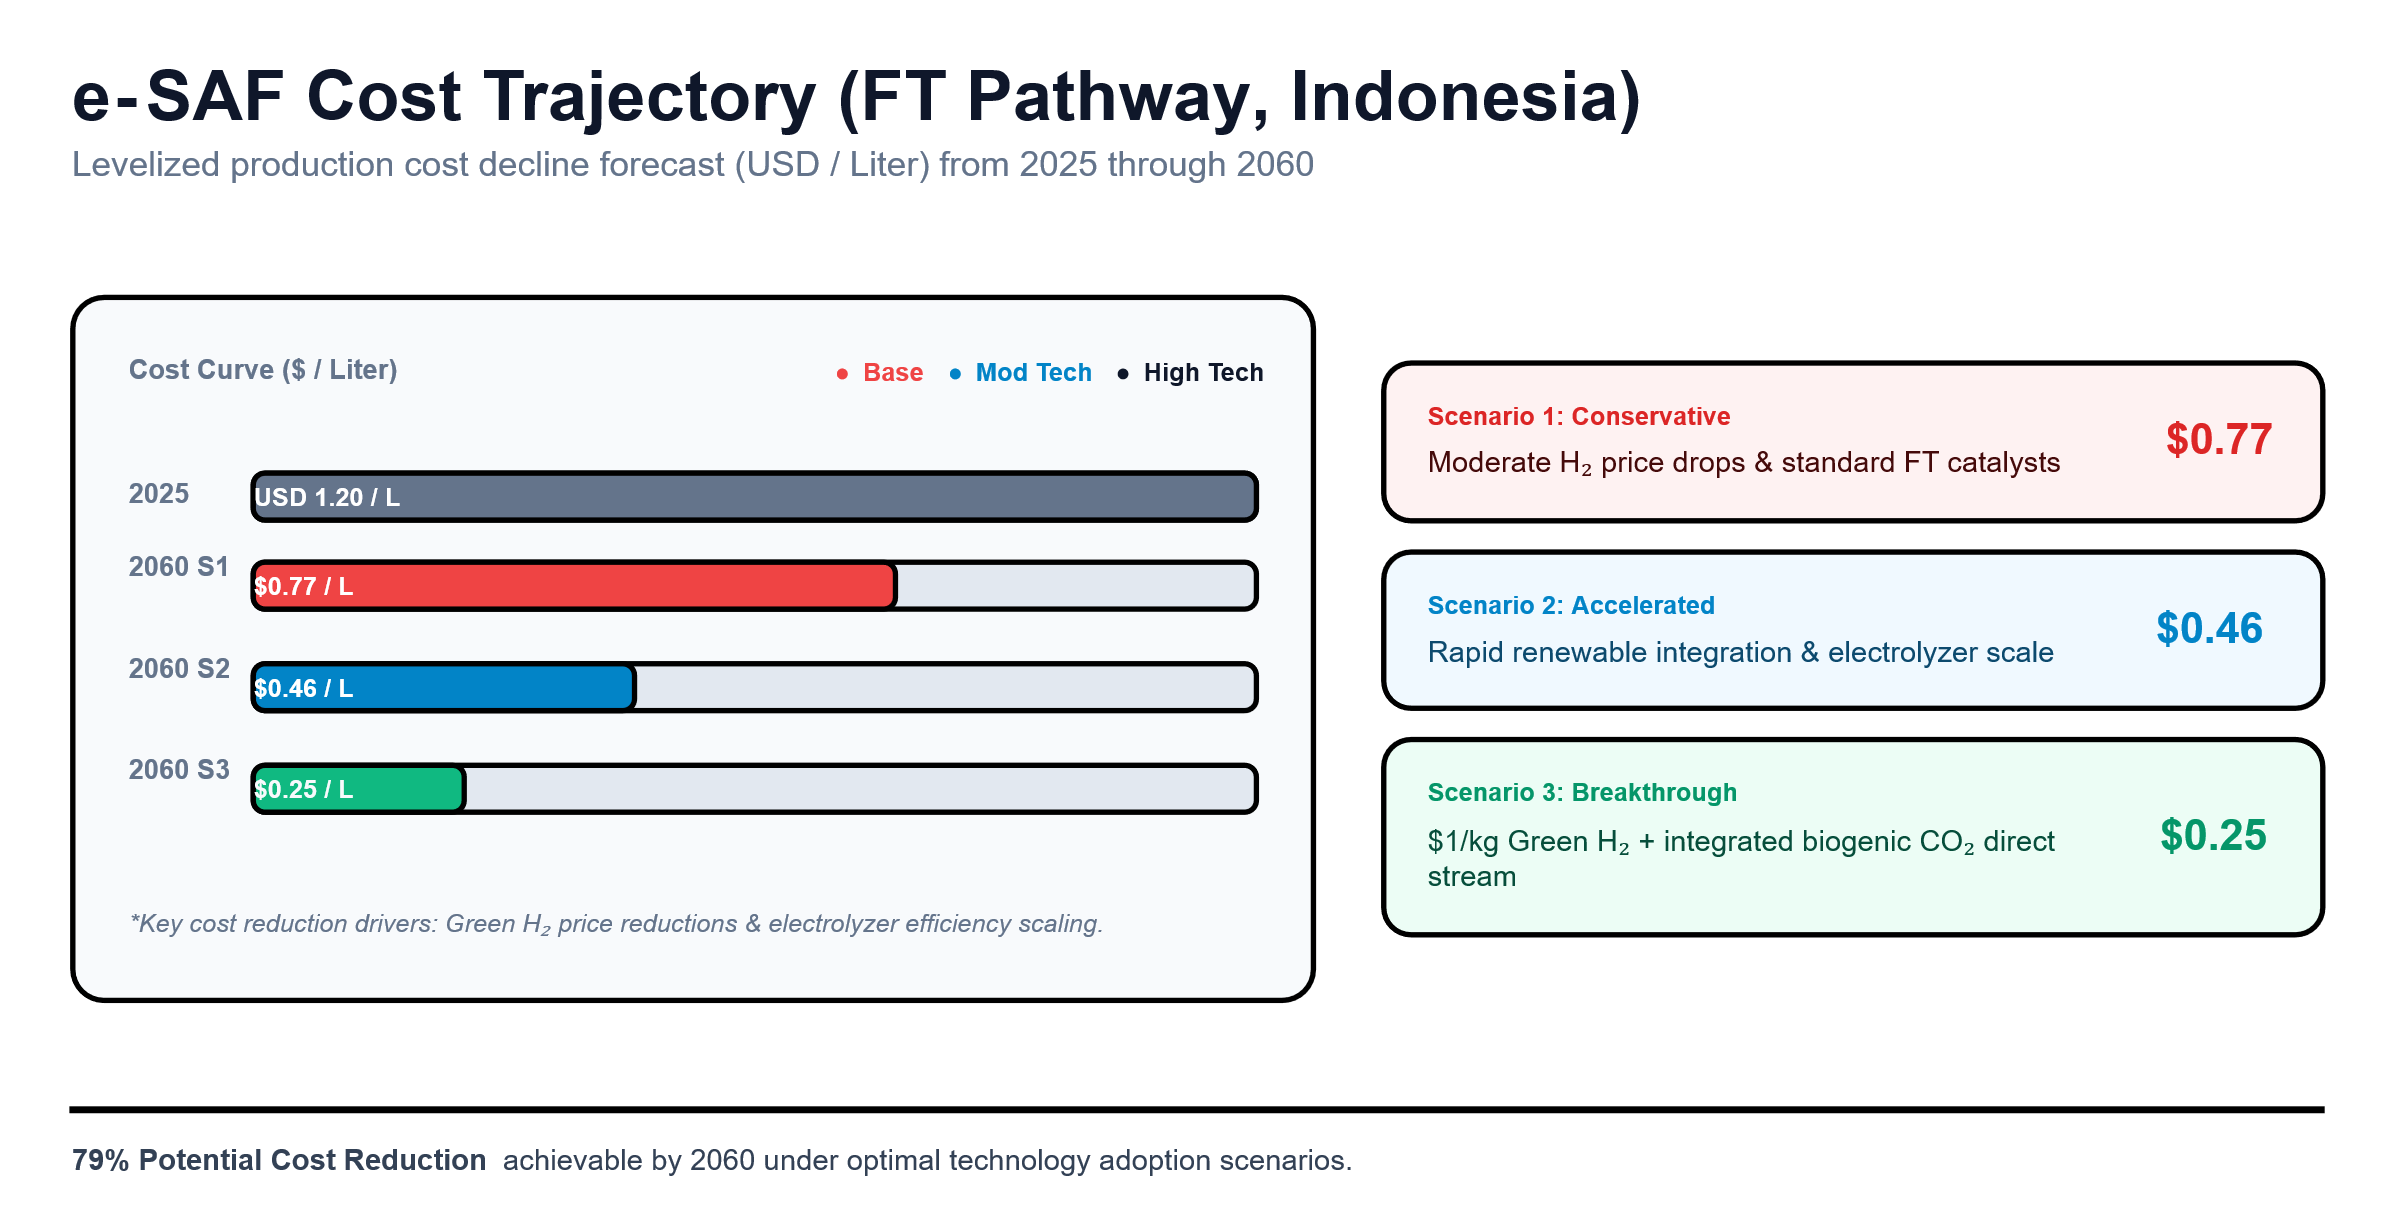
Benchmark 2025 production costs for e-SAF via FT range from USD 1.20 to 2.30 per litre (Indonesia: USD 1.20/L; Malaysia: USD 2.30/L; Thailand: USD 1.50/L), while HEFA pathway costs range from USD 1.60 to 2.10 per litre, fully consistent with IRENA (2024) regional benchmarks. Technological learning drives substantial cost declines by 2060:
- Indonesia (FT Pathway): Costs fall from USD 1.20/L (2025) to USD 0.77/L (Scenario 1, LR = 11.95%), USD 0.46/L (Scenario 2, LR = 23.90%), and USD 0.25/L (Scenario 3, LR = 35.85%).
- Malaysia (FT Pathway): Costs fall from USD 2.30/L (2025) to USD 1.47/L (Scenario 1), USD 0.88/L (Scenario 2), and USD 0.48/L (Scenario 3).
- Thailand (FT Pathway): Costs fall from USD 1.50/L (2025) to USD 0.96/L (Scenario 1), USD 0.57/L (Scenario 2), and USD 0.31/L (Scenario 3).
BECCS Carbon Capture Unit Costs
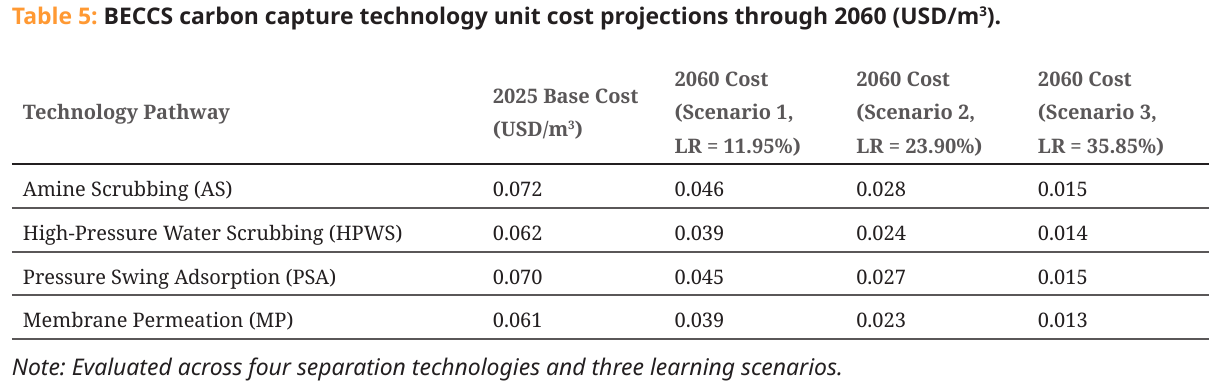
Initial capture costs for biogenic CO₂ from biogas streams start at USD 0.061–0.072 per m³ in 2025. Cumulative deployment reduces capture costs significantly by 2060 across all separation technologies.
Cost trajectories under Scenario 1 (LR = 11.95%), Scenario 2 (LR = 23.90%), and Scenario 3 (LR = 35.85%).
4. Policy Frameworks, Technology Transfer, and Bioeconomy Management
Realising the potential of POME valorisation in Southeast Asia requires addressing structural, regulatory, and market barriers.
4.1 Cross-Border Technology Transfer and Capacity Building
Biogas upgrading, biogenic gas fractionation, and catalytic e-SAF synthesis require specialised industrial infrastructure. Regional technology transfer mechanisms under ASEAN governance should focus on:
- Decentralised Modular Processing: Developing standardised POME upgrading units capable of operating at individual oil palm mills (processing 30–60 tonnes of fresh fruit bunches [FFB] per hour).
- Joint R&D Frameworks: Establishing collaborative research initiatives between ASEAN centres of excellence (e.g., BRIN Indonesia, JGSEE Thailand, IPB University) to commercialise advanced membrane separation and Fischer–Tropsch catalysis.
4.2 Regulatory Standards and Blended Finance Mechanisms
Capital investment in bioenergy requires long-term regulatory certainty and de-risking financial structures:
- Standardised Carbon Accounting: Aligning national carbon accounting rules with Article 6 of the Paris Agreement to facilitate cross-border trading of BECCS negative emissions credits.
- Blending Mandates: Establishing progressive regional blend targets for SAF (e.g., 2% by 2030, scaling to 30% by 2050) to guarantee offtake demand.
- Blended Finance: Utilising green bond taxonomies, multilateral development financing, and concessional loans to de-risk commercial debt for POME-to-biogas infrastructure.
4.3 Smallholder Integration and Community Governance
Smallholder farmers manage approximately 40% of ASEAN palm oil land (Qaim et al., 2020). Including smallholders in POME supply chains is critical for equitable bioeconomy development:
- Yield Intensification: Enhancing smallholder agronomic productivity reduces expansion pressure on forest frontiers while increasing FFB availability for centralised mills.
- Cooperative Biogas Hubs: Establishing shared community-owned POME processing hubs allows smallholders to participate in biogas value chains, generating supplementary revenues.
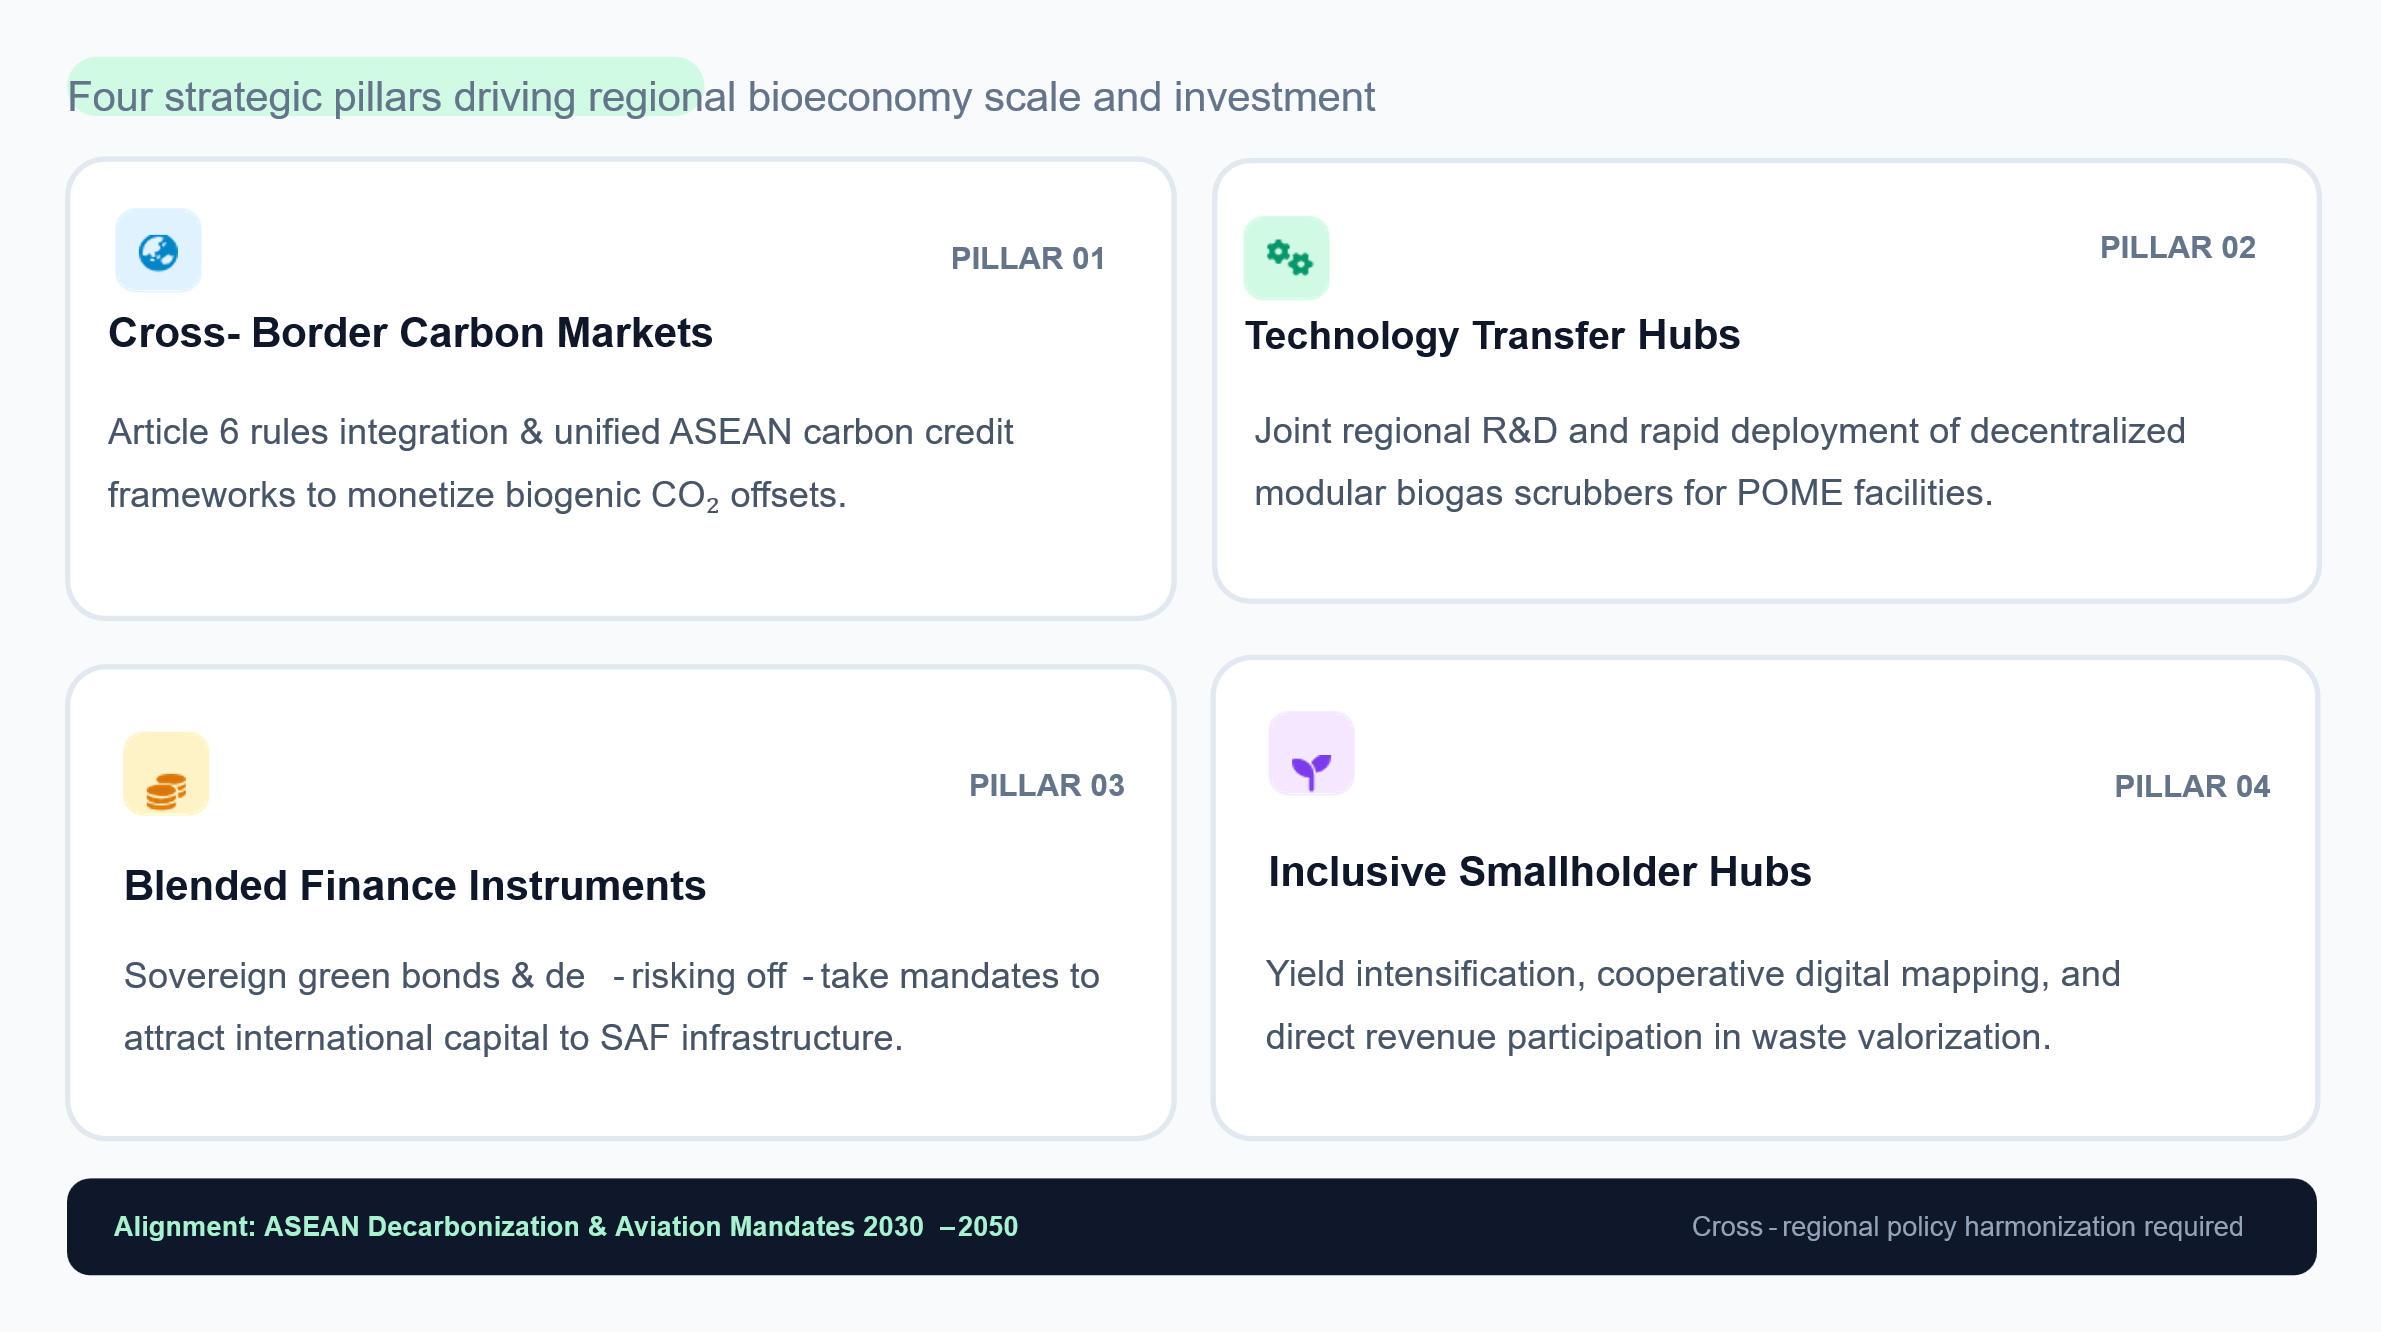
Key policy, financial, and technological enablers for ASEAN regional implementation.
5. Conclusion
Valorising POME across Southeast Asia offers a dual benefit: producing renewable low-carbon fuels and generating permanent biogenic carbon removals. Spatial analysis confirms 23.97 million hectares of oil palm coverage across ASEAN. Under an aggressive Net Zero scenario through 2060, POME-derived biogas reaches 7,342 million m³, providing 4,588 million m³ of biomethane (16.13 TWh power potential), sequestering 5.06 million tonnes of biogenic CO₂ via BECCS, and supporting up to 36.69 billion US gallons of e-SAF.
Technoeconomic assessments demonstrate that deployment scale and learning curves can reduce BECCS capture costs down to USD 0.013–0.015 per m³ and lower e-SAF production costs to USD 0.25–0.77 per litre by 2060. Capitalising on these opportunities requires coordinated regional policies, cross-border technology transfer, blended finance instruments, and inclusive smallholder integration to advance the bioeconomy transition across Southeast Asia.
Acknowledgements
The authors thank Rizky Purnomo and Kurniawan Yulianto for their assistance in data collection.
References
1. Agrawal, A., Verschueren, R., Diamond, S., & Boyd, S. (2018). A rewriting system for convex optimization problems. Journal of Control and Decision, 5(1), 42–60.
2. Aziz, N. I. H. A., Hanafiah, M. M., Gheewala, S. H., & Ismail, H. (2020). Bioenergy for a cleaner future: A case study of sustainable biogas supply chain in the Malaysian energy sector. Sustainability, 12(8), 3213.
3. Clinton, N., Vollrath, A., D’Annunzio, R., Liu, D., Glick, H. B., Descals, A., … (2024). A community palm model [Preprint]. arXiv. https://arxiv.org/abs/2405.09530
4. DEDE. (2024). Thailand alternative energy development plan and biogas statistics. Department of Alternative Energy Development and Efficiency, Ministry of Energy.
5. Descals, A., Wich, S., Meijaard, E., Gaveau, D. L. A., Peedell, S., & Szantoi, Z. (2021). High-resolution global map of smallholder and industrial closed-canopy oil palm plantations. Earth System Science Data, 13, 1211–1231.
6. Descals, A., Gaveau, D. L. A., Wich, S., Szantoi, Z., & Meijaard, E. (2024). Global mapping of oil palm planting year from 1990 to 2021. Earth System Science Data, 16, 5111–5129.
7. Energy Commission. (2024). Malaysia national energy statistics and renewable bioenergy data. Energy Commission Malaysia.
8. Energy Market Estimates. (2024). Southeast Asia regional bioenergy technoeconomic and fuel price outlook. Regional Market Intelligence Report.
9. Feng, Y., & Rosa, L. (2024). Global biomethane and carbon dioxide removal potential through anaerobic digestion of waste biomass. Environmental Research Letters, 19(2), 024024.
10. IEA. (2024). Southeast Asia energy outlook 2024. International Energy Agency.
11. IPCC. (2023). Climate change 2023: Synthesis report. Contribution of Working Groups I, II, and III to the Sixth Assessment Report of the Intergovernmental Panel on Climate Change. Intergovernmental Panel on Climate Change.
12. IRENA. (2024). Sustainable aviation fuels in Southeast Asia: A regional perspective on bio-based solutions. International Renewable Energy Agency.
13. MEMR. (2024). Handbook of energy and economic statistics of Indonesia. Ministry of Energy and Mineral Resources.
14. Qaim, M., Sibhatu, K. T., Siregar, H., & Grass, I. (2020). Environmental, economic, and social consequences of the oil palm boom. Annual Review of Resource Economics, 12, 321–344.
15. Rahayu, A. S., Karsiwulan, D., Yuwono, H., Trisnawati, I., Mulyasari, S., Rahardjo, S., Hokermin, S., & Paramita, V. (2015). Handbook POME-to-biogas project development in Indonesia (B. Castermans, H. Yuwono, R. Hardison, & V. Paramita, Eds.). Winrock International.
16. Silalertruksa, T., & Gheewala, S. H. (2012). Environmental sustainability assessment of palm biodiesel production in Thailand. Energy, 43, 306–314.
17. Swinbourn, R., Li, C., & Wang, F. (2024). A comprehensive review on biomethane production from biogas separation and its techno-economic assessments. ChemSusChem, e202400779, 1–37.
18. Van Rossum, G., & Drake, F. L. (2002). Python reference manual release 2.2.1. Python Software Foundation.
Technology offer
Interested in this technology?
Request further information or explore potential cooperation with the technology provider.
Technology request
Can you help meet this technology need?
Share a relevant technology, expertise or partnership opportunity with APCTT.